Grafana Cloud Integration for Third-Party Monitoring
Connect all your vendors' status pages to Grafana Cloud. Push service incidents to Loki for complete observability in your Grafana dashboards.
14-day free trial · No credit card required · 6320+ cloud services available
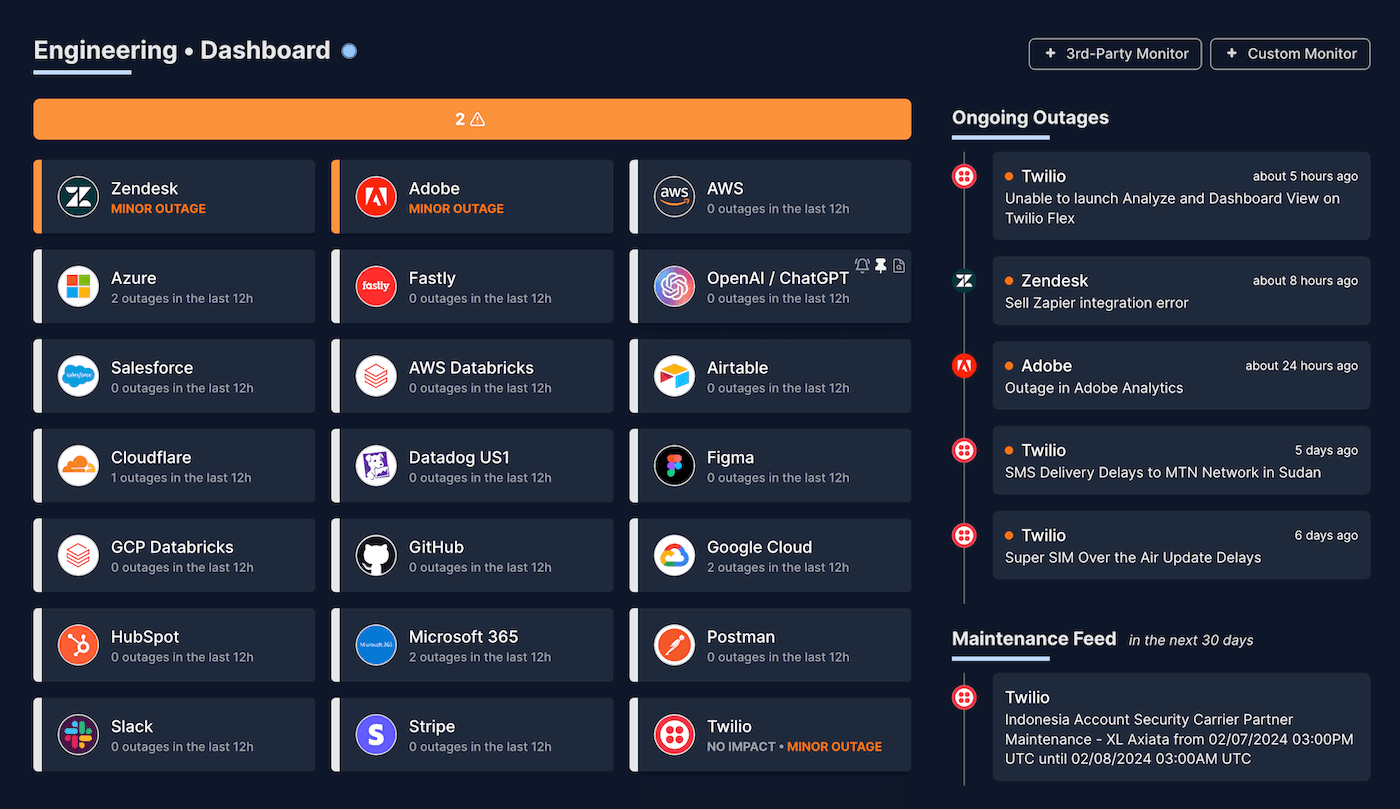


Complete Third-Party Visibility in Your Grafana Dashboards
Incidents in Loki
Push real-time service incidents to Grafana Loki. Query with LogQL and visualize service status alongside your application metrics.
Customizable Monitoring
Monitor only the services and components critical to your business. Filter by severity, region, or specific components to reduce noise.
Unified Observability
Correlate third-party outages with your application metrics and logs. Build comprehensive dashboards showing your entire stack health.
Easy Setup
Simple configuration with Cloud Access Policies. No complex OAuth flows. Just create an access policy token in Grafana Cloud and start monitoring in minutes.
6320+ status pages available
IsDown monitors status pages for all major cloud services. Continuously updated to include new services as they become available.
How it works with Grafana Cloud
Get started in minutes with our simple setup process
01
Pick the vendors you rely on from our 6320+ services list
Select from our extensive list of supported status pages and choose the services critical to your business. Filter by components and regions to monitor only what impacts you.
02
Configure your Grafana Cloud integration
Create a Cloud Access Policy in your Grafana Cloud instance with logs:write scope. Enter your region, stack ID, and token in IsDown to complete the connection.
03
Visualize in Grafana dashboards
Incident details stream to Loki as structured logs. Query with LogQL to build comprehensive dashboards showing your entire stack's health.
Leverage Grafana's Full Observability Stack
| Without IsDown | With IsDown + Grafana | |
|---|---|---|
| Third-Party Metrics | No visibility into vendor status | Real-time incident logs in Loki |
| Incident Tracking | Manual checking of status pages | Structured logs in Loki with full context |
| Data Correlation | Isolated monitoring silos | Unified dashboards with PromQL & LogQL |
| Historical Analysis | Limited or no historical data | Complete incident history in Loki |
Frequently Asked Questions
How does the Grafana Cloud integration work?
IsDown pushes incident events to Grafana Loki as structured logs. You can query this data using LogQL in your Grafana dashboards.
What data is sent to Grafana Cloud?
To Loki: Incident lifecycle events with title, description, affected components, severity, and timestamps as structured JSON logs.
Do I need a specific Grafana Cloud plan?
Any Grafana Cloud plan with Loki access will work. You'll need to create a Cloud Access Policy with logs:write scope.
How often is data pushed to Grafana?
Incident events are pushed to Loki in near real-time as they occur, including updates and resolutions.
Can I create alerts based on this data?
Yes! You can create Grafana alerts based on log patterns in Loki. Set up alert rules to notify your team via Grafana's alerting channels.
Which Grafana Cloud instances are supported?
IsDown supports all Grafana Cloud instances. Simply provide your Loki endpoint URL from your Grafana Cloud portal.
Fantastic monitoring tool.
Get outage alerts for all your third-party services and ability to use the integration widely available on different platforms to get the best in class experience. Questions/issues addressed in a very helpful and timely manner.
Dong F.
/ Oct 24, 2024
DevOps and SRE must have tool for monitoring dependencies.
It's been great to use IsDown so far. Previously we had multiple different channels to observe statuses of the services we depended on. At times we missed setting up a few. But with IsDown everything is already configured, I just had to select which services I need to monitor.
Ishan K.
/ Sep 19, 2024
Never again lose time looking in the wrong place
14-day free trial · No credit card required · No code required