Use cases
Software Products E-commerce MSPs Schools Development & Marketing DevOps Agencies Help Desk
Company
Internet Status Blog Pricing Log in Get started free

See Vendor Status in Your Datadog Dashboards

IsDown sends real-time vendor status metrics to Datadog. When AWS, Stripe, or GitHub has an issue, it shows up alongside your own metrics. Correlate vendor outages with your system behavior in one view.

14-day free trial No credit card required 5-minute setup

We used to juggle multiple channels to observe the services we depend on. With IsDown, I just pick which services to monitor.

Ishan K., DevOps Engineer

If you are in IT, SRE, or Security and work in an environment with a lot of SaaS (which, let's face it, is all of them) - IsDown is your new best friend. Helpfully aggregates various status pages from services into a very clear dashboard. Worth every penny.

Mike S., IT Manager
IsDown + Datadog

Vendor Status Data, Native in Datadog

IsDown sends service checks from 6320+ vendors directly into your Datadog dashboards, monitors, and alerts.

Native Metrics

Vendor status as native Datadog metrics

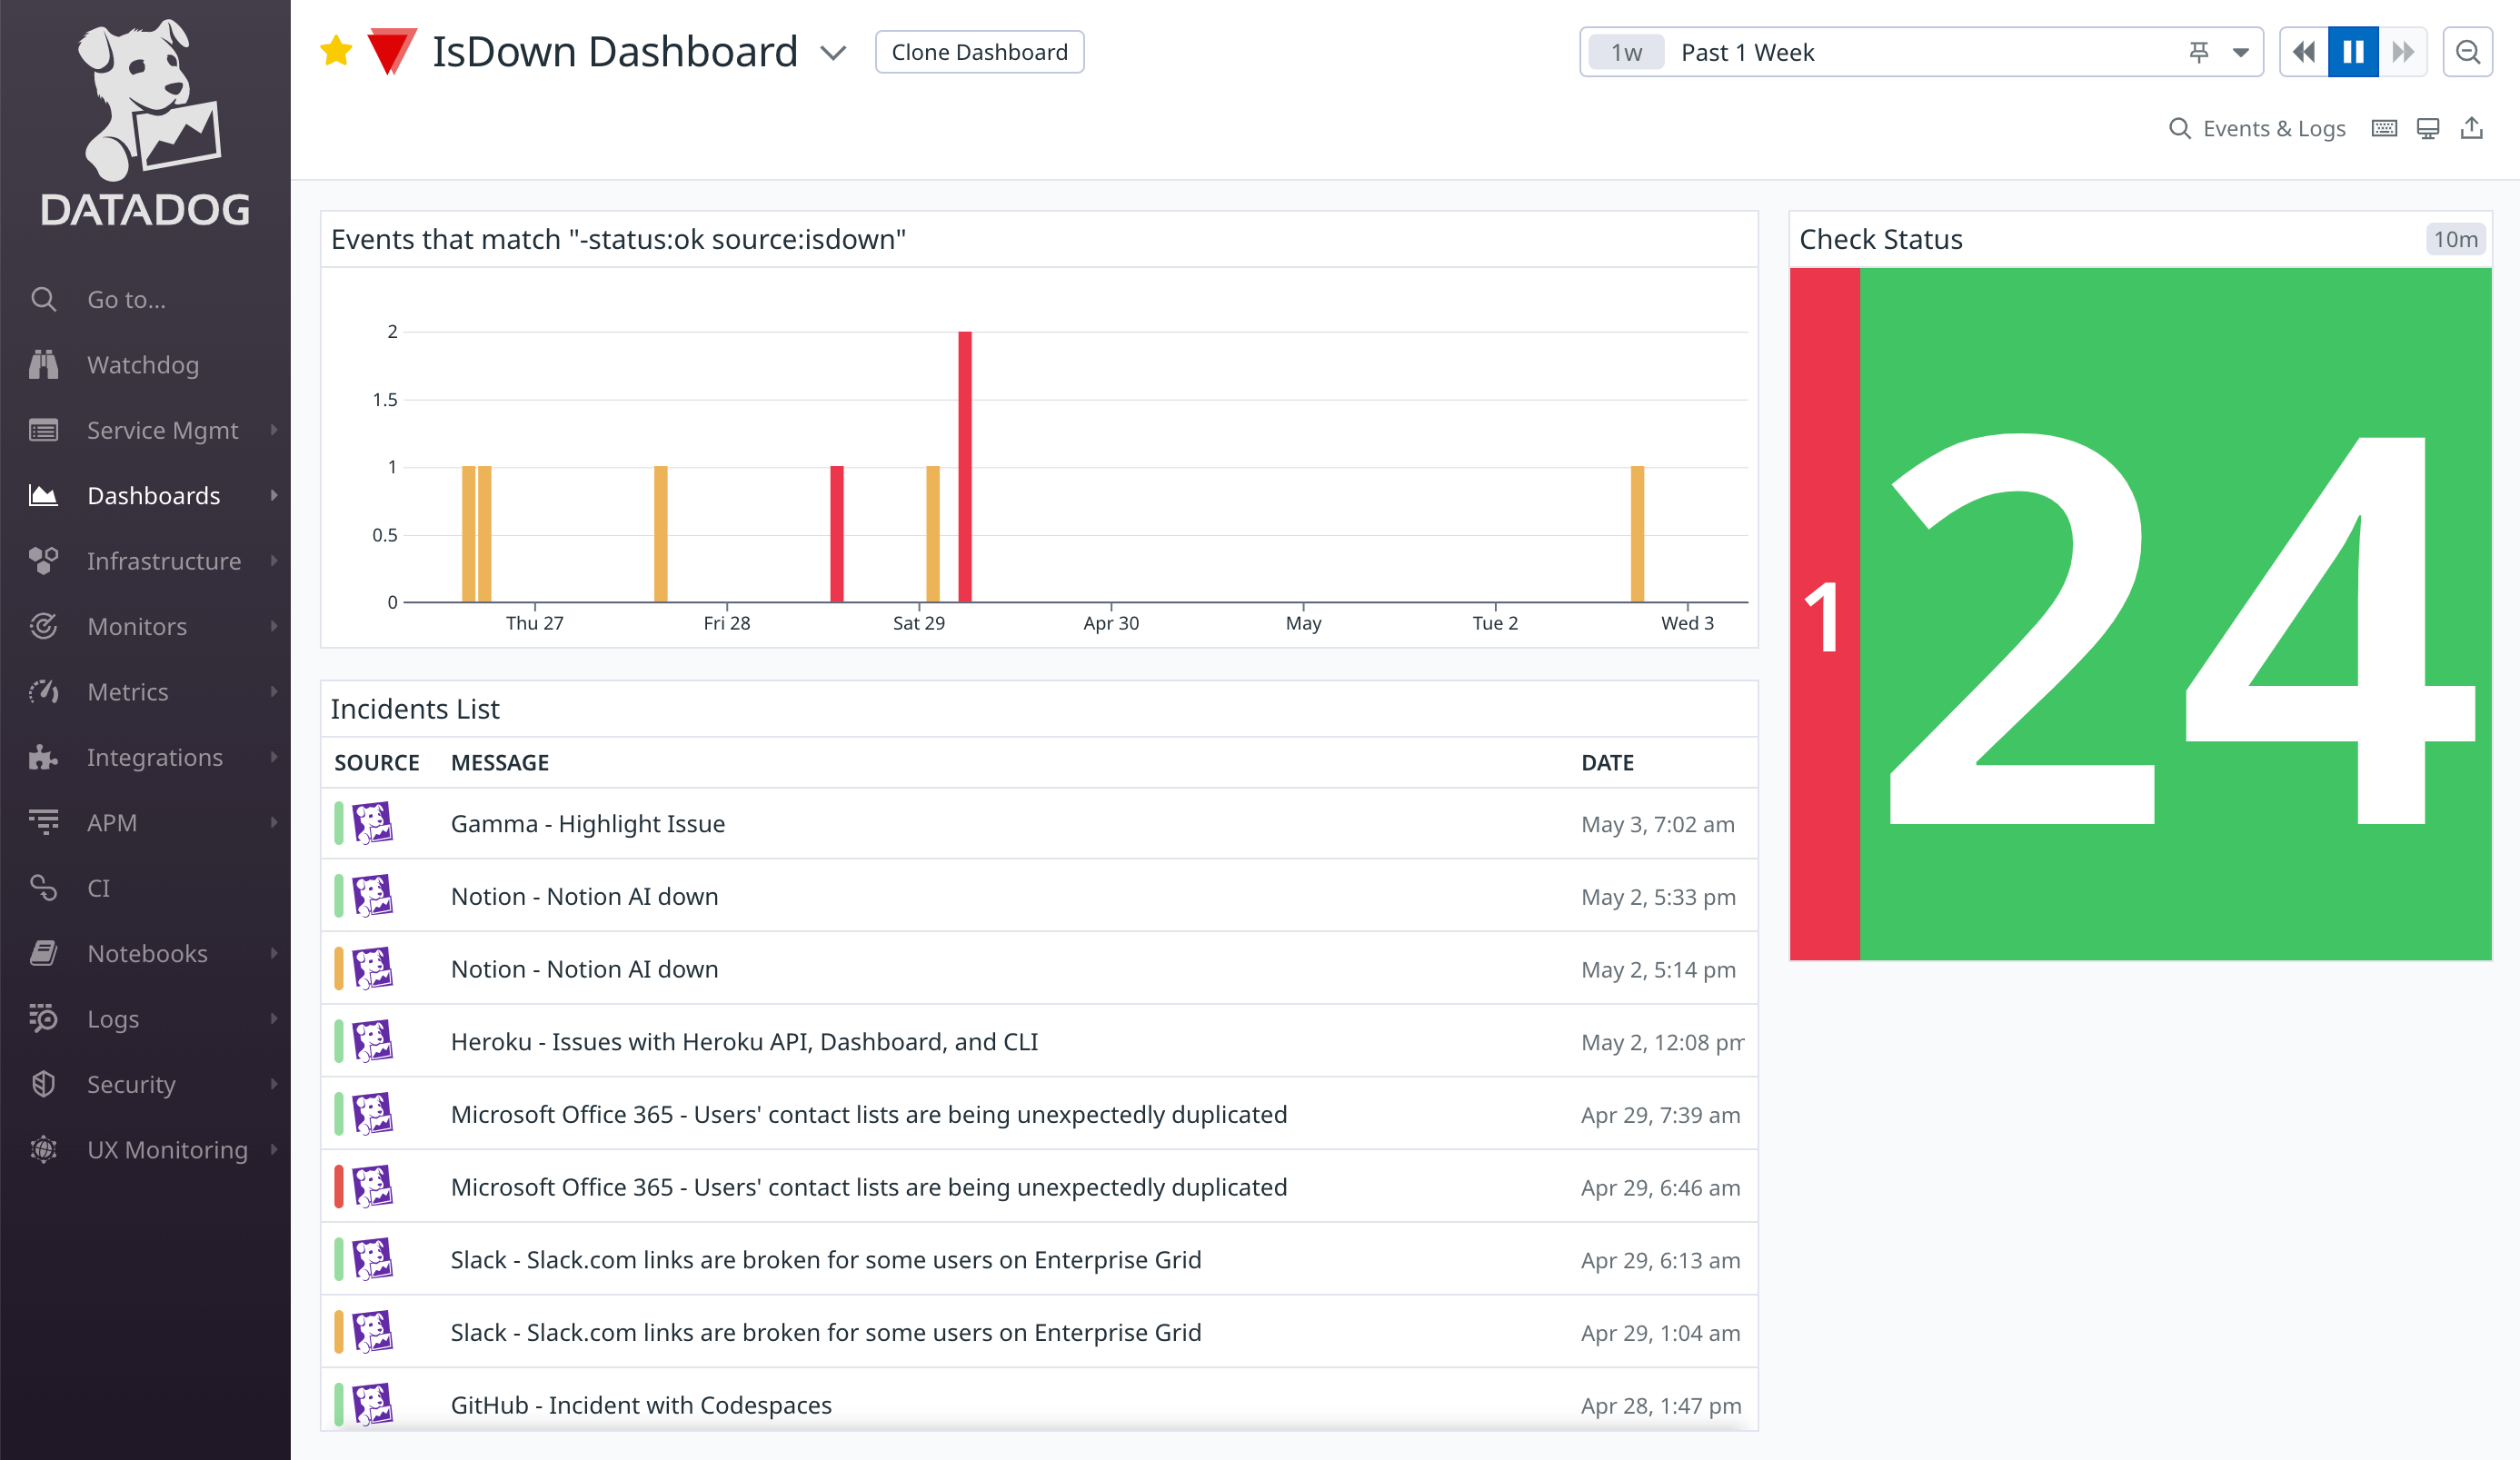
IsDown sends service check data directly to Datadog. Build dashboards, set monitor thresholds, and alert on vendor status the same way you do for your own infrastructure.

  • Service checks appear natively in Datadog
  • Build dashboards with vendor health data
  • Set monitor thresholds and composite monitors
Datadog dashboard showing vendor status metrics from IsDown
Correlation

Correlate outages with your own data

When latency spikes, see at a glance whether it's your code or a vendor. IsDown metrics appear on the same timeline as your application metrics.

  • Vendor status on the same timeline as your metrics
  • Instant correlation during incidents
  • Stop debugging your code when it's a vendor issue
IsDown and Datadog Integration for vendor outage correlation
Early Detection

Earlier than the vendor admits

IsDown detects outages independently. Often before the vendor updates their status page. Your Datadog monitors fire before the vendor announcement.

  • Independent outage detection
  • Alerts before vendor acknowledgment
  • Coverage across 6320+ services
Postmortems

Historical data for postmortems

Every vendor incident is stored with timestamps and affected components. Pull it into your postmortem timeline alongside Datadog traces to reconstruct exactly what happened.

  • Full incident history with timestamps
  • Affected components and regions tracked
  • Reconstruct timelines for post-incident review
Simple Setup

How it works with Datadog

Get started in minutes. Three steps to see vendor status in your Datadog dashboards.

Step 01

Pick the vendors you rely on

Select from our 6320+ supported status pages and choose the services critical to your business. Don't see what you need? Let us know and we'll add it ASAP.

Step 02

Connect your Datadog account

Authorize IsDown to send service checks to your Datadog account. Select which vendors and metrics you want to track. The integration uses native Datadog service checks.

Step 03

See vendor status in your dashboards

IsDown monitors your vendors continuously. When an incident is detected, service check data flows into Datadog. Build dashboards, set monitors, and correlate vendor status with your own metrics.

Setup takes less than 2 minutes. Try it free.

14-day free trial · No credit card required · No code required

Why IsDown + Datadog

Stop Context-Switching Between Tools During Incidents

Without IsDown
  • Your team switches between Datadog and vendor status pages trying to figure out if the problem is yours or theirs.
  • Vendor outages are invisible in Datadog. Latency spikes trigger your monitors but the root cause is a mystery.
  • Postmortems lack vendor context. You know when your service degraded, but not when the vendor incident started.
With IsDown + Datadog
  • Vendor status appears natively in your Datadog dashboards.
  • Instant correlation: your metrics + vendor status on one timeline.
  • Postmortems include full vendor incident data.
  • Your Datadog monitors fire before the vendor acknowledges the issue.
Start Free Trial

14-day free trial · No credit card required

Use Cases

How engineering teams use IsDown + Datadog

Vendor status data in the platform your team already lives in.

Observability Teams

Correlate vendor outages with your own metrics instantly

You track p99 latency in Datadog. When it spikes, you need to know in seconds: is it your service or a vendor? IsDown adds vendor status as a Datadog overlay. The correlation is instant.

Platform Engineering

Build a vendor health dashboard in 10 minutes

Your team manages 30+ vendor dependencies. Rather than context-switching to check status pages, vendor health is a metric in Datadog like any other. Build a vendor health dashboard in minutes.

Incident Review

Reconstruct incident timelines with vendor data

After a major incident, your team reconstructs the timeline in Datadog. IsDown's historical vendor data shows exactly when the vendor started degrading, down to the minute, so you can correlate with your own service behavior.

Frequently Asked Questions

How does IsDown send data to Datadog?

IsDown sends service checks to Datadog — the same check type your own monitors use. This means vendor status data appears natively in dashboards, monitors, and alerts. You can set monitor thresholds, create composite monitors, and include vendor status in any Datadog dashboard.

Can I alert in PagerDuty or Slack from Datadog when a vendor goes down?

Yes. Since IsDown data is native Datadog service checks, you can use Datadog's full alerting stack to route vendor outage notifications to PagerDuty, Slack, or any other notification channel you've configured in Datadog.

How do I connect IsDown to Datadog?

After signing up, go to your IsDown dashboard, then Alerts & Integrations, then Add Datadog. Authorize IsDown to send metrics to your Datadog account, and you're set. No coding required.

Which services does IsDown monitor?

IsDown monitors 6320+ services including AWS, Azure, GCP, Stripe, GitHub, Salesforce, Datadog, and more. If a service has a public status page, we likely monitor it.

Can I create custom Datadog dashboards with IsDown data?

Yes. All IsDown metrics are available as native Datadog service checks. Create custom dashboards, set up composite monitors, and visualize vendor health alongside your own infrastructure metrics.

How quickly is data updated in Datadog?

IsDown continuously monitors status pages and updates Datadog service checks every minute. When an incident is detected, your Datadog monitors fire within seconds.

Start monitoring third-party vendors in Datadog

14-day free trial · No credit card required · No code required