Is Grafana Cloud: Graphite Down? Current Status and Outages
Grafana status updated

Current Grafana Cloud: Graphite status
Grafana Cloud: Graphite is working normally
IsDown last checked Grafana Cloud: Graphite status on at . We've received 0 user reports in the past 24 hours.
Want to know the next time Grafana Cloud: Graphite is down? Start free 14-day trial.
Monitoring since Apr 2020
·
0 incidents caught
·
459 components tracked in real-time
Grafana Cloud: Graphite service health over the last 24 hours
This chart shows the number of user-reported issues for Grafana Cloud: Graphite service health over the past 24 hours, grouped into 20-minute intervals. It's normal to see occasional reports, which may be due to individual user issues rather than a broader problem. Sign up to get alerts when Grafana Cloud: Graphite is down.
Outage Map
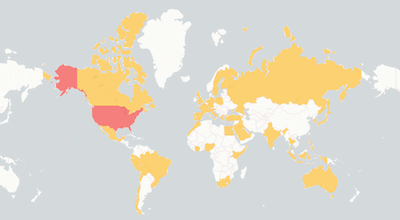
See where users report Grafana Cloud: Graphite is down. The map shows recent Grafana Cloud: Graphite outages from around the world.
Grafana Cloud: Graphite Outage MapTrusted by 1,000+ teams
Never miss outages in third-party dependencies
Stop finding out about outages from your users. Monitor 6,320+ cloud services and get alerted the second something breaks.

Related services
GitHub
AWS
Slack
Microsoft Azure
Google Cloud
Salesforce
Google Workspace
Microsoft 365
New Relic
Jira Software
Confluence
Microsoft 365 Consumer
Adobe
Okta
1Password
GitHub
AWS
Slack
Microsoft Azure
Google Cloud
Salesforce
Google Workspace
Microsoft 365
New Relic
Jira Software
Confluence
Microsoft 365 Consumer
Adobe
Okta
1Password
Grafana Cloud: Graphite Components Status
Check if any Grafana Cloud: Graphite component is down. View the current status of 18 services and regions.
| Component | Status |
|---|---|
| AWS Australia - prod-au-southeast-1: Ingestion | OK |
| AWS Australia - prod-au-southeast-1: Querying | OK |
| AWS Brazil - prod-sa-east-1: Ingestion | OK |
| AWS Brazil - prod-sa-east-1: Querying | OK |
| AWS Canada - prod-ca-east-0: Ingestion | OK |
| AWS Canada - prod-ca-east-0: Querying | OK |
| AWS Germany - prod-eu-west-2: Ingestion | OK |
| AWS Germany - prod-eu-west-2: Querying | OK |
| AWS India - prod-ap-south-1: Ingestion | OK |
| AWS India - prod-ap-south-1: Querying | OK |
| AWS Singapore - prod-ap-southeast-1: Ingestion | OK |
| AWS Singapore - prod-ap-southeast-1: Querying | OK |
| AWS Sweden - prod-eu-north-0: Ingestion | OK |
| AWS Sweden - prod-eu-north-0: Querying | OK |
| AWS US East - prod-us-east-0: Ingestion | OK |
| AWS US East - prod-us-east-0: Querying | OK |
| AWS US West - prod-us-west-0: Ingestion | OK |
| AWS US West - prod-us-west-0: Querying | OK |
Only showing 18 of 44 components being monitored for Grafana Cloud: Graphite
Trusted by 1,000+ teams
Never miss outages in third-party dependencies
Stop finding out about outages from your users. Monitor 6,320+ cloud services and get alerted the second something breaks.
Monitor Grafana alongside these services
Teams that track Grafana status also keep an eye on these services. Add them all to your IsDown dashboard for a single view of your dependencies.

Sapiensia Tecnologia
Application Monitoring
OK

Splunk Observability Cloud US0
Application Monitoring
OK

Highlight.io
Application Monitoring
OK

OpsLevel
Application Monitoring
OK

SLA Monitoring
Application Monitoring
OK

Lakeside Software
Application Monitoring
OK

Google Play
E-Commerce
OK

Microsoft Intune
Security Operations
OK

Youtube
Video Platforms
OK

AT&T
VoIP & Communication
OK

Microsoft Entra ID
Identity & Authentication
OK

Workday
Human Resources
OK

Inspector
Application Monitoring
OK

Dead Man's Snitch
Application Monitoring
OK

Checkly
Application Monitoring
OK
Frequently Asked Questions
Is Grafana Cloud: Graphite down today?
Grafana Cloud: Graphite is down. You can check Grafana Cloud: Graphite status and incident details on the top of the page. IsDown continuously monitors Grafana Cloud: Graphite official status page every few minutes. In the last 24 hours, there were 0 outages reported.
What is the current Grafana Cloud: Graphite status?
Grafana Cloud: Graphite seems to be having problems. You can check Grafana Cloud: Graphite status and incident details on the top of the page. The status is updated in almost real-time, and you can see the latest outages and issues affecting customers.
Is there a Grafana Cloud: Graphite outage now?
No, there is no ongoing official outage. Check on the top of the page if there are any reported problems by other users.
Is Grafana Cloud: Graphite down today or just slow?
Currently there's no report of Grafana Cloud: Graphite being slow. Check on the top of the page if there are any reported problems by other users.
How are Grafana Cloud: Graphite outages detected?
IsDown monitors the Grafana Cloud: Graphite official status page every few minutes. We also get reports from users like you. If there are enough reports about an outage, we'll show it on the top of the page.
Is Grafana Cloud: Graphite having an outage right now?
We don't have a record of Grafana Cloud: Graphite last outage
How often does Grafana Cloud: Graphite go down?
IsDown has tracked 0 Grafana Cloud: Graphite incidents since April 2020.
Is Grafana Cloud: Graphite down for everyone or just me?
Check the Grafana Cloud: Graphite status at the top of this page. IsDown combines official status page data with user reports to show whether Grafana Cloud: Graphite is down for everyone or if the issue is on your end.
How to check if Grafana is down?
- Subscribe (if possible) to updates on the official status page.
- Create an account in IsDown. Start monitoring Grafana and get alerts in real-time when Grafana has outages.
Why use IsDown to monitor Grafana instead of the official status page?
Because IsDown is a status page aggregator, which means that we aggregate the status of multiple cloud services. You can monitor Grafana and all the services that impact your business. Get a dashboard with the health of all services and status updates. Set up notifications via Slack, Datadog, PagerDuty, and more, when a service you monitor has issues or when maintenances are scheduled.
How IsDown compares to DownDetector when monitoring Grafana?
IsDown and DownDetector help users determine if Grafana is having problems. The big difference is that IsDown is a status page aggregator. IsDown monitors a service's official status page to give our customers a more reliable source of information instead of just relying on reports from users. The integration allows us to provide more details about Grafana's Outages, like incident title, description, updates, and the parts of the affected service. Additionally, users can create internal status pages and set up notifications for all their third-party services.
Latest Articles from our Blog


Monitor Grafana Cloud: Graphite status and get alerts when it's down
14-day free trial · No credit card required · No code required