Grafana status. Check if Grafana is down right now
Grafana status updated
Is Grafana down?
Grafana is working normally
IsDown checked Grafana status on at , and appears to be operational. We've received 0 user reports in the past 24 hours.
IsDown collects in real-time Grafana status data from official sources and user reports.
Ongoing Incident
started about 4 hours ago
Degraded Writes in AWS us-east-2
Details
Issues reported in the last 24 hours
Number of user-reported issues for Grafana over the past 24 hours, grouped into 20-minute intervals. It's normal to see occasional reports, which may be due to individual user issues rather than a broader problem. We only consider an issue widespread if there are multiple reports within a short timeframe.

See where Grafana users are reporting performance issues or even downtime. The map shows recent reports from around the world.
Grafana Outages Map
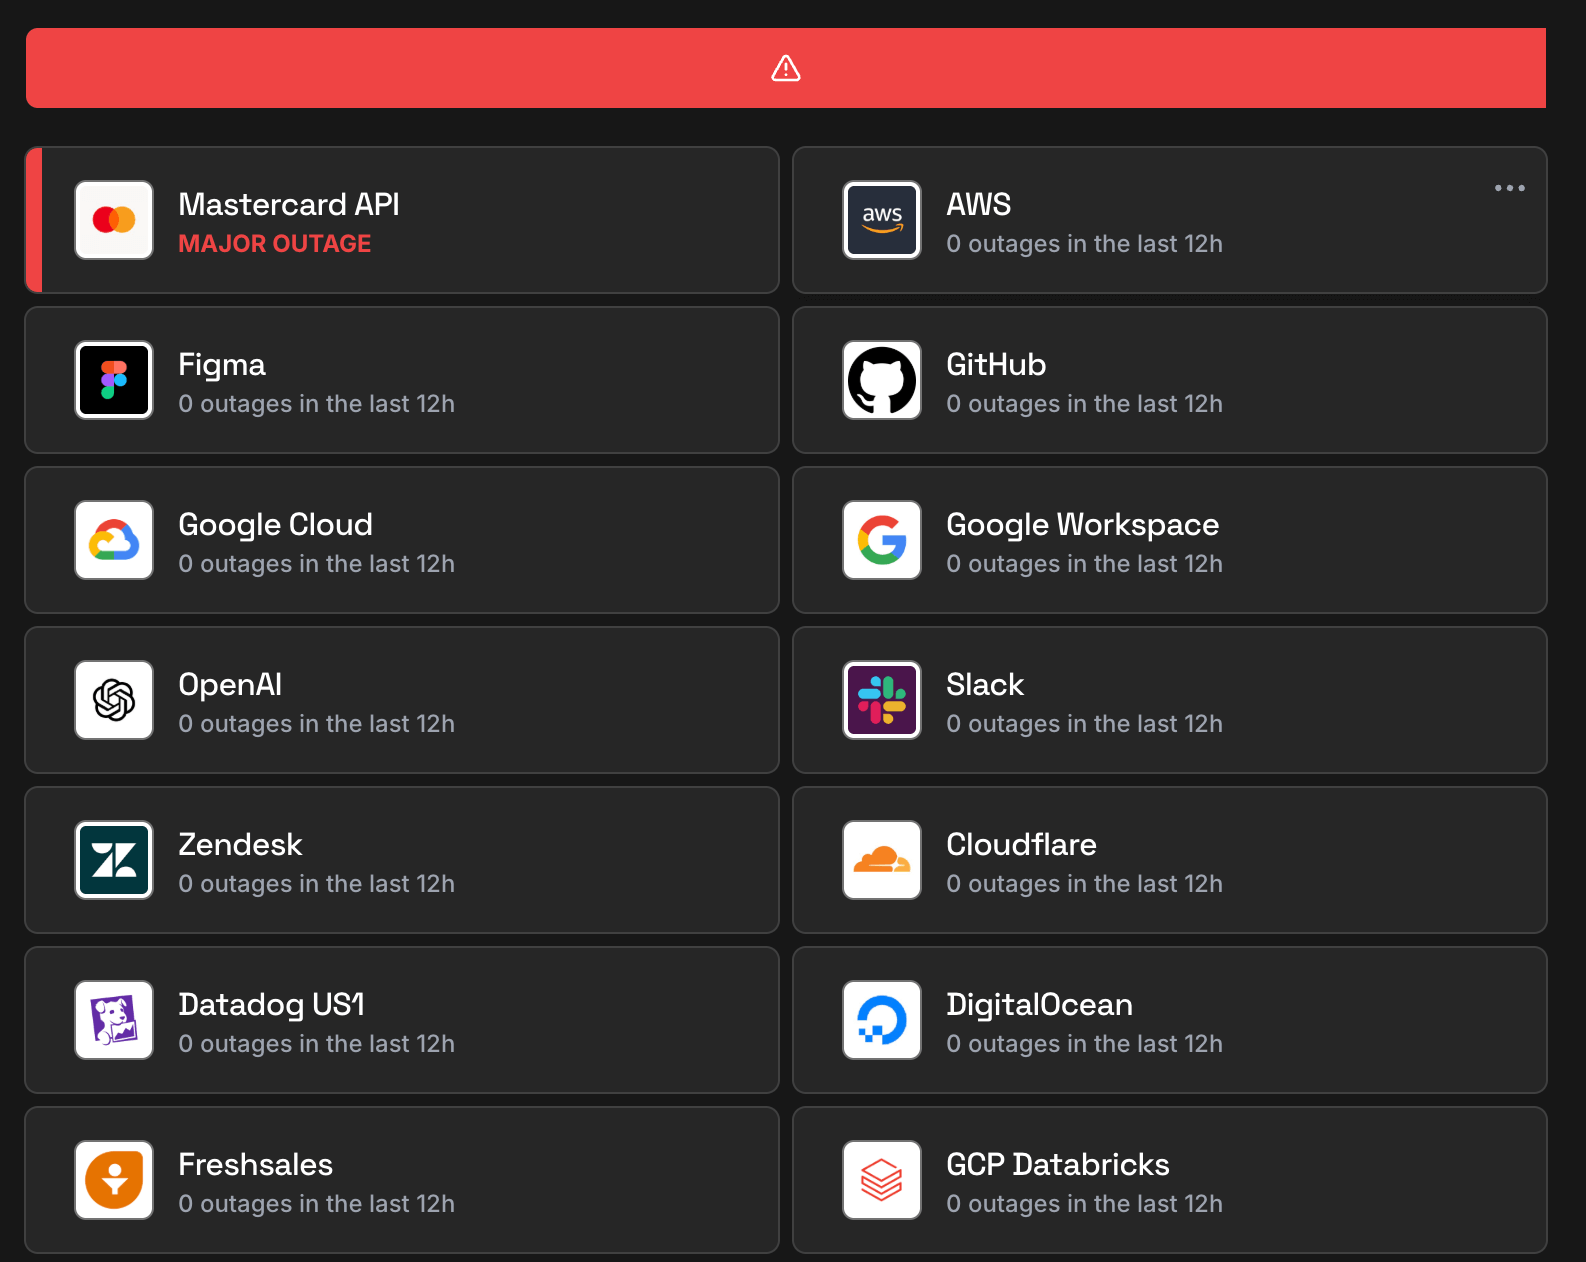
Related services
 AWS
AWS
 GitHub
 Slack
Slack
 Microsoft Azure
 Google Cloud
 Salesforce
 New Relic
 Confluence
 Microsoft 365 Consumer
 HubSpot
 GitLab
 Cloudflare
 Google Workspace
 Adobe
Adobe
 Jira Software
AWS
GitHub
Slack
Microsoft Azure
Google Cloud
Salesforce
New Relic
Confluence
Microsoft 365 Consumer
HubSpot
GitLab
Cloudflare
Google Workspace
Adobe
Jira Software
Jira Software
AWS
GitHub
Slack
Microsoft Azure
Google Cloud
Salesforce
New Relic
Confluence
Microsoft 365 Consumer
HubSpot
GitLab
Cloudflare
Google Workspace
Adobe
Jira Software
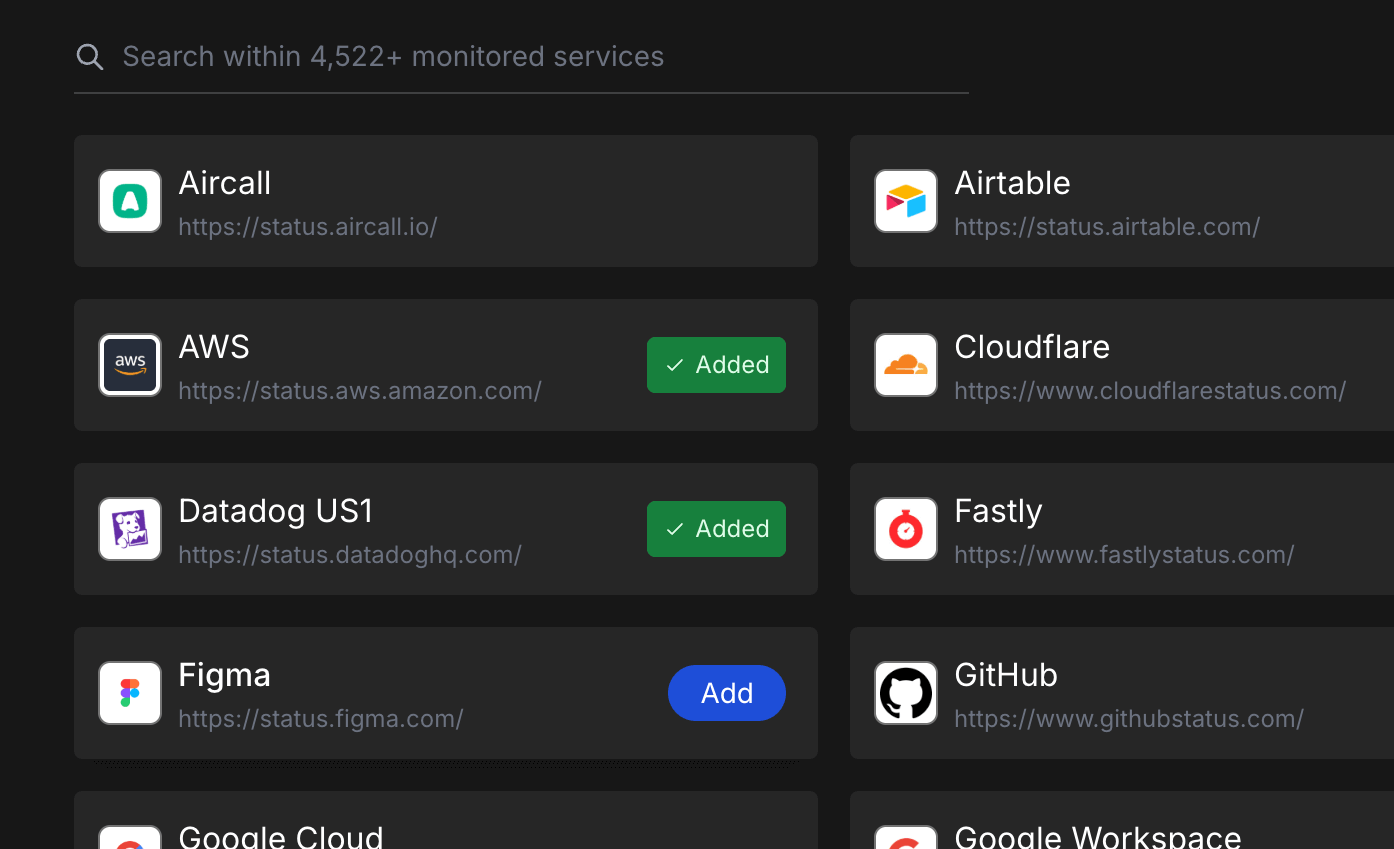
Looking to track Grafana & all your external dependencies downtime and outages?
- Monitor all your external dependencies in one place
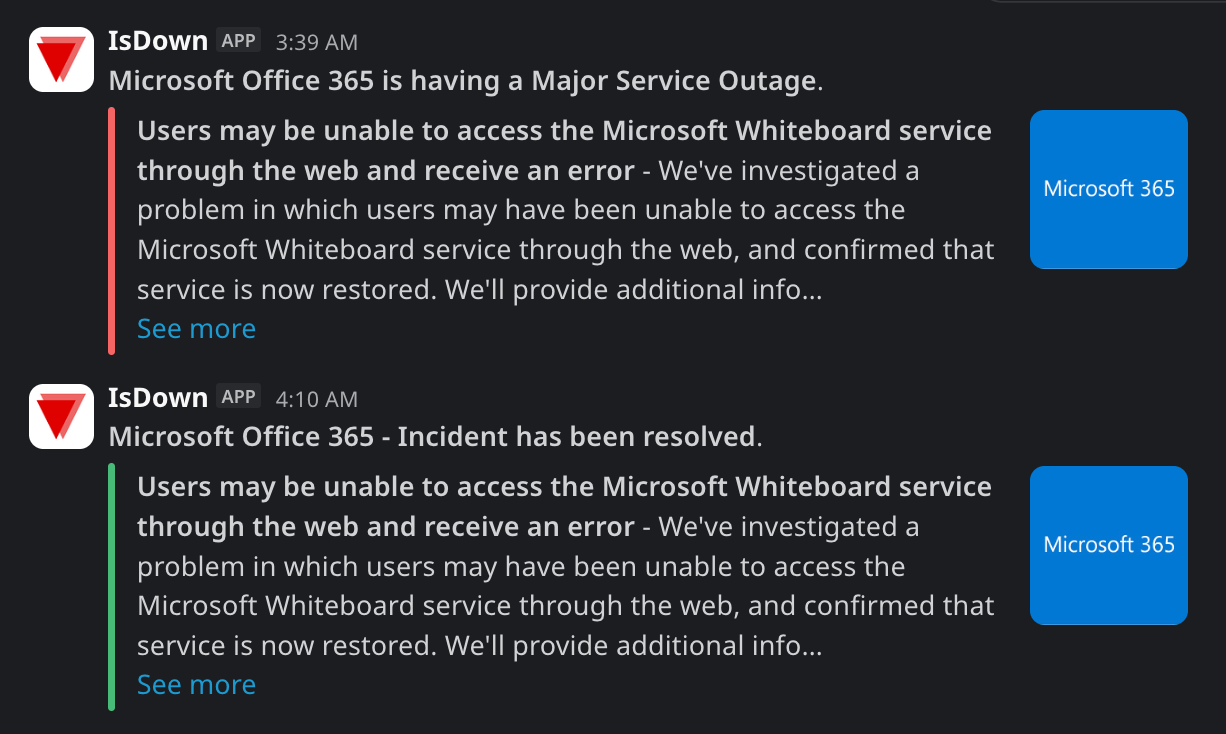
- Get instant alerts when outages are detected
- Be the first to know if service is down
- Show real-time status on private or public status page
- Keep your team informed

Recent outage reports
See what users are saying about Grafana issues that impacted them and how they are affected by the outage.
-
Grafana metrics outage/degradation.
-
Pierre - No data for all panels with "Expressions".
Downtime health for the last 90 days
In the last 90 days, Grafana had 46 incidents (28 major outages and 18 minor incidents) with a median duration of 1 hour 47 minutes.
46
Incidents
28
Major Outages
18
Minor Incidents
1
hour
Median Resolution
Latest incidents and outages history
IsDown has tracked 639 incidents since started monitoring Grafana status in April 2020. We collect data from 5420+ services, and normalize the data to give you a clear picture of the impact of the outage. It will show official Grafana outages and also issues that we're started by a spike in crowdsource reports.
about 3 hours
Jan 02, 2026 at 10:44 AM
| Title | Started At | Duration |
|---|---|---|
|
We are currently investigating an issue causing degraded write performance across multiple produc...
|
Jan 17, 2026 at 07:51 AM UTC
|
about 1 hour |
|
As of 23:57 UTC, our engineers became aware of an issue with prod-us-west-0 resulting in a partia...
|
Jan 16, 2026 at 12:28 AM UTC
|
about 4 hours |
|
We're experiencing an issue with connectivity loss for Azure PrivateLink endpoints in all availab...
|
Jan 14, 2026 at 02:30 PM UTC
|
about 6 hours |
|
We are investigating an issue in prod-eu-west-3 where PDC agents are failing to maintain/re-estab...
|
Jan 12, 2026 at 03:44 PM UTC
|
about 3 hours |
|
We have been alerted to an issue with Tempo write degradation in prod-eu-west-3 - tempo-prod-08. ...
|
Jan 12, 2026 at 09:03 AM UTC
|
about 6 hours |
|
We are currently investigating an issue causing degraded Mimir and Tempo read performance in the ...
|
Jan 06, 2026 at 05:41 PM UTC
|
about 3 hours |
|
We are currently investigating this issue.
|
Jan 02, 2026 at 10:44 AM UTC
|
about 3 hours |
|
We are currently investigating an issue impacting PDC Queries in the Prod-Us-East-3 region. This ...
|
Dec 23, 2025 at 08:31 PM UTC
|
about 2 hours |
|
We are currently investigating an issue that is causing intermittent failure when trying to start...
|
Dec 19, 2025 at 04:10 PM UTC
|
42 minutes |
Be the first to know when Grafana goes down
- Monitor all your external dependencies in one place
- Get instant alerts when outages are detected
- Be the first to know if service is down
- Show real-time status on private or public status page
- Keep your team informed
Scheduled maintenances
IsDown aggregates scheduled maintenances for Grafana. Currently, there are 1 more maintenances scheduled.
-
Jan 21 2026Synthetic monitoring secrets
Scheduled for January 21, 2026 at 01:00 PM WET · until 04:00 PM WET
We will perform planned maintenance to synthetic monitoring secrets on Wednesday January 21st, from 13:00 to 16:00 UTC, in the following regions: prod-us-central-0, prod-us-east-0, and prod-eu-west-2. During maintenance synthetic monitoring ...
Components / Services / Regions current status
Check the current status of the 24 components, services, or regions being monitored for Grafana.