Kyruus ProviderMatch Analytics status. Is Kyruus ProviderMatch Analytics down right now?
Kyruus status updated a few minutes ago
What is Kyruus ProviderMatch Analytics status right now?
Kyruus ProviderMatch Analytics is working normally
Kyruus ProviderMatch Analytics service health over the last 24 hours
This chart shows the number of user-reported issues for Kyruus ProviderMatch Analytics service health over the past 24 hours, grouped into 20-minute intervals. It's normal to see occasional reports, which may be due to individual user issues rather than a broader problem.
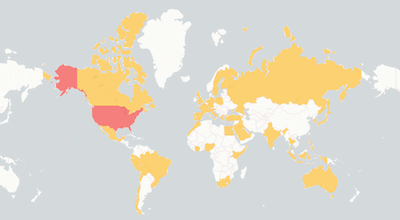
ProviderMatch Analytics Outage Map

See where users report Kyruus ProviderMatch Analytics is down. The map shows recent Kyruus ProviderMatch Analytics outages from around the world.
ProviderMatch Analytics Outage MapMonitor Kyruus ProviderMatch Analytics status and outages
- Monitor all your external dependencies in one place
- Get instant alerts when outages are detected
- Be the first to know if service is down
- Show real-time status on private or public status page
- Keep your team informed
Kyruus ProviderMatch Analytics Components Status
Check if any Kyruus ProviderMatch Analytics component is down. View the current status of 2 services and regions.
| Component | Status |
|---|---|
| In-App Analytics Dashboards | OK |
| Provider Data Extracts (PDE) Reports | OK |
Frequently Asked Questions
Is Kyruus ProviderMatch Analytics down today?
Kyruus ProviderMatch Analytics isn't down. You can check Kyruus ProviderMatch Analytics status and incident details on the top of the page. IsDown continuously monitors Kyruus ProviderMatch Analytics official status page every few minutes. In the last 24 hours, there were 0 outages reported.
What is the current Kyruus ProviderMatch Analytics status?
Kyruus ProviderMatch Analytics is currently operational. You can check Kyruus ProviderMatch Analytics status and incident details on the top of the page. The status is updated in almost real-time, and you can see the latest outages and issues affecting customers.
Is there a Kyruus ProviderMatch Analytics outage now?
No, there is no ongoing official outage. Check on the top of the page if there are any reported problems by other users.
Is Kyruus ProviderMatch Analytics down today or just slow?
Currently there's no report of Kyruus ProviderMatch Analytics being slow. Check on the top of the page if there are any reported problems by other users.
How are Kyruus ProviderMatch Analytics outages detected?
IsDown monitors the Kyruus ProviderMatch Analytics official status page every few minutes. We also get reports from users like you. If there are enough reports about an outage, we'll show it on the top of the page.
Is Kyruus ProviderMatch Analytics having an outage right now?
We don't have a record of Kyruus ProviderMatch Analytics last outage
How IsDown compares to DownDetector when monitoring Kyruus?
IsDown and DownDetector help users determine if Kyruus is having problems. The big difference is that IsDown is a status page aggregator. IsDown monitors a service's official status page to give our customers a more reliable source of information instead of just relying on reports from users. The integration allows us to provide more details about Kyruus's Outages, like incident title, description, updates, and the parts of the affected service. Additionally, users can create internal status pages and set up notifications for all their third-party services.
Latest Articles from our Blog
Monitor Kyruus ProviderMatch Analytics status and get alerts when it's down
14-day free trial · No credit card required · No code required


