Is DigitalOcean Monitoring Down? What is the current status?
DigitalOcean Monitoring status is
operational
Start monitoring DigitalOcean and all your cloud vendors in minutes
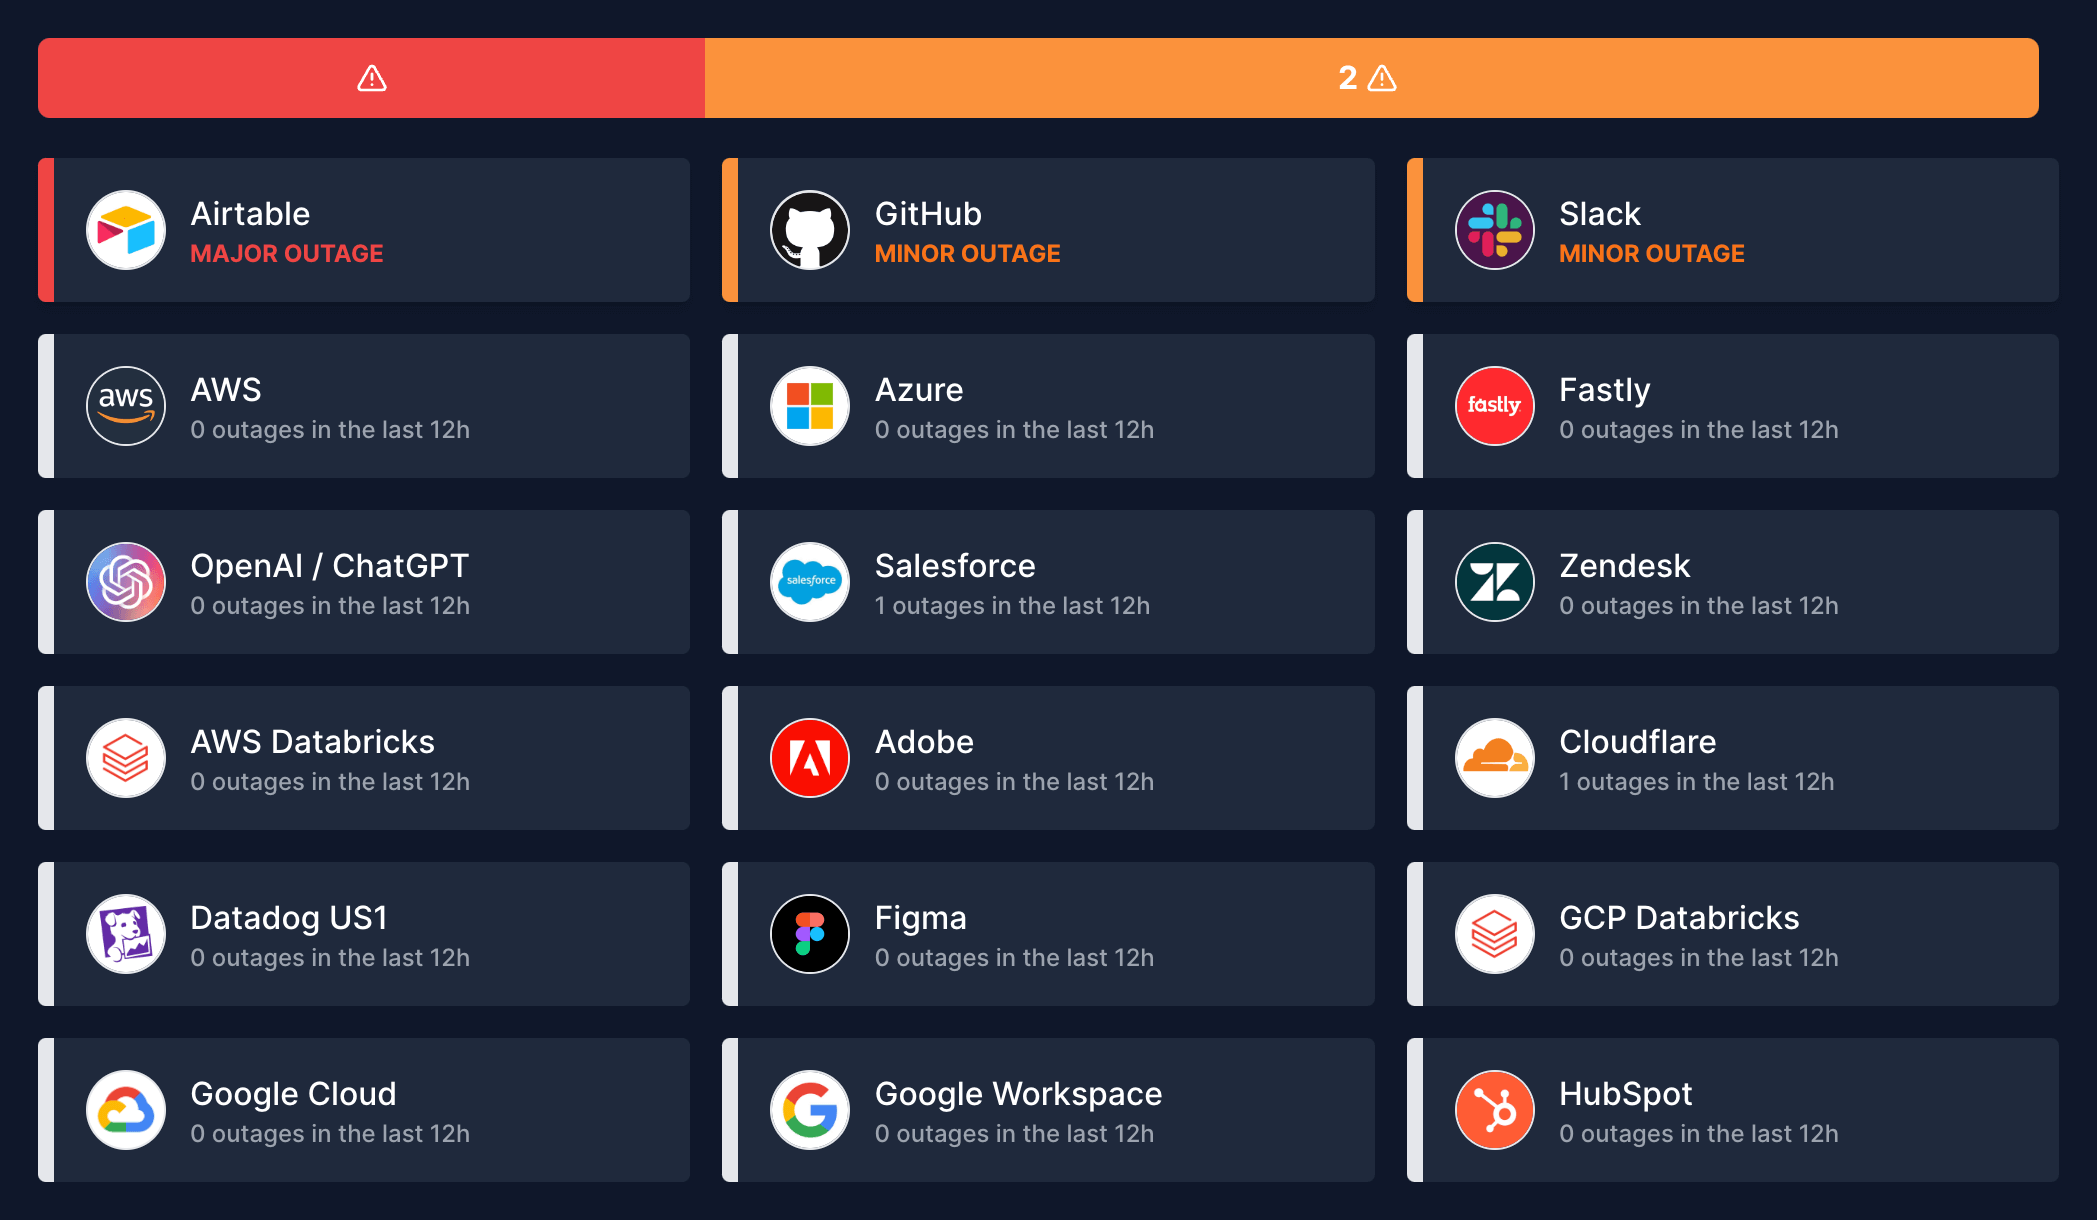
Monitor DigitalOcean and all cloud providers in one place
Choose the exact services and components you want to monitor
Send alerts to email, Slack, Microsoft Teams, Datadog, and more
Create a status page for quick overview of all your services