Is QuickNode Dashboard Down? Current Status and Outages
QuickNode status updated a few minutes ago

Current QuickNode Dashboard status
QuickNode Dashboard is working normally
IsDown last checked QuickNode Dashboard status on at . We've received 0 user reports in the past 24 hours.
Want to know the next time QuickNode Dashboard is down? Start free 14-day trial.
Monitoring since Jan 2023
·
28 incidents caught
·
85 components tracked in real-time
QuickNode Dashboard service health over the last 24 hours
This chart shows the number of user-reported issues for QuickNode Dashboard service health over the past 24 hours, grouped into 20-minute intervals. It's normal to see occasional reports, which may be due to individual user issues rather than a broader problem. Sign up to get alerts when QuickNode Dashboard is down.
Outage Map
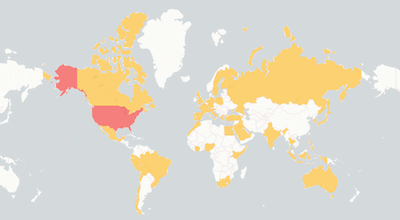
See where users report QuickNode Dashboard is down. The map shows recent QuickNode Dashboard outages from around the world.
QuickNode Dashboard Outage MapTrusted by 1,000+ teams
The Status Page Aggregator with Early Outage Detection
Stop finding out about outages from your users. Monitor 6,320+ cloud services and get alerted the second something breaks.

Related services
QuickNode Downtime Health — Last 90 Days
In the last 90 days, QuickNode had 4 incidents with a median duration of 2 hours 33 minutes.
4
Incidents
0
Major Outages
4
Minor Incidents
2
hour
Median Resolution
Recent QuickNode Dashboard outages detected
Full incident reports for recent QuickNode Dashboard outages, including timelines, affected components, and resolution details.
about 5 hours
Mar 17, 2026 at 03:11 PM
| Title | IsDown detected At | Duration |
|---|---|---|
|
We are investigating the degraded performance of the Quicknode dashboard. Users may have issues a...
|
May 20, 2026 at 01:27 PM UTC
|
about 1 hour |
|
We’re currently experiencing a delay in billing-related data appearing in the dashboard. Charges ...
|
May 11, 2026 at 04:51 PM UTC
|
about 3 hours |
|
We're currently investigating an issue where some users may experience longer load times on the d...
|
May 10, 2026 at 04:17 PM UTC
|
about 9 hours |
|
We are currently investigating this issue.
|
May 08, 2026 at 07:45 AM UTC
|
about 2 hours |
|
We are currently investigating an issue intermittently affecting the QuickNode Dashboard, Streams...
|
Apr 12, 2026 at 08:55 AM UTC
|
about 8 hours |
|
We are investigating issues impacting REST APIs including Streams, Webhooks, and KV Store. Users ...
|
Mar 17, 2026 at 07:11 PM UTC
|
about 5 hours |
|
Some users have reported experiencing a bug where they are a paid user on a BUILD plan, but seein...
|
Dec 11, 2025 at 11:11 AM UTC
|
about 1 hour |
|
We are currently observing a service degradation with our Quicknode dashboards. You may see error...
|
Dec 05, 2025 at 12:28 PM UTC
|
32 minutes |
|
The QuickNode team is investigating the degraded performance of The QuickNode Dashboard - we will...
|
Nov 10, 2025 at 05:01 PM UTC
|
36 minutes |
|
We are currently investigating an issue causing intermittent timeouts when accessing the QuickNod...
|
Oct 20, 2025 at 05:07 AM UTC
|
about 15 hours |
Monitor QuickNode alongside these services
Teams that track QuickNode status also keep an eye on these services. Add them all to your IsDown dashboard for a single view of your dependencies.

Messari
API Services
OK

EVRYTHNG
API Services
OK

DispatchIt
API Services
OK

Orderful
API Services
OK

Kombo
API Services
OK

Phantombuster
API Services
OK

Aircall
VoIP & Communication
OK

TeamViewer
Team Collaboration
MAJOR

Ubiquiti
Network Infrastructure
OK

Snowflake
Data Warehousing
OK

Microsoft Entra ID
Identity & Authentication
OK

WhatsApp
Chat & Messaging
OK

Whop
API Services
OK

Sila
API Services
OK

Highway
API Services
OK
Frequently Asked Questions
Is QuickNode Dashboard down today?
QuickNode Dashboard is down. You can check QuickNode Dashboard status and incident details on the top of the page. IsDown continuously monitors QuickNode Dashboard official status page every few minutes. In the last 24 hours, there were 2 outages reported.
What is the current QuickNode Dashboard status?
QuickNode Dashboard seems to be having problems. You can check QuickNode Dashboard status and incident details on the top of the page. The status is updated in almost real-time, and you can see the latest outages and issues affecting customers.
Is there a QuickNode Dashboard outage now?
No, there is no ongoing official outage. Check on the top of the page if there are any reported problems by other users.
Is QuickNode Dashboard down today or just slow?
Currently there's no report of QuickNode Dashboard being slow. Check on the top of the page if there are any reported problems by other users.
How are QuickNode Dashboard outages detected?
IsDown monitors the QuickNode Dashboard official status page every few minutes. We also get reports from users like you. If there are enough reports about an outage, we'll show it on the top of the page.
Is QuickNode Dashboard having an outage right now?
QuickNode Dashboard last outage was on May 20, 2026 with the title "Quicknode Dashboard - Degraded Performance"
How often does QuickNode Dashboard go down?
IsDown has tracked 28 QuickNode Dashboard incidents since January 2023. When QuickNode Dashboard goes down, incidents typically resolve within 222 minutes.
Is QuickNode Dashboard down for everyone or just me?
Check the QuickNode Dashboard status at the top of this page. IsDown combines official status page data with user reports to show whether QuickNode Dashboard is down for everyone or if the issue is on your end.
How to check if QuickNode is down?
- Subscribe (if possible) to updates on the official status page.
- Create an account in IsDown. Start monitoring QuickNode and get alerts in real-time when QuickNode has outages.
Why use IsDown to monitor QuickNode instead of the official status page?
Because IsDown is a status page aggregator, which means that we aggregate the status of multiple cloud services. You can monitor QuickNode and all the services that impact your business. Get a dashboard with the health of all services and status updates. Set up notifications via Slack, Datadog, PagerDuty, and more, when a service you monitor has issues or when maintenances are scheduled.
How IsDown compares to DownDetector when monitoring QuickNode?
IsDown and DownDetector help users determine if QuickNode is having problems. The big difference is that IsDown is a status page aggregator. IsDown monitors a service's official status page to give our customers a more reliable source of information instead of just relying on reports from users. The integration allows us to provide more details about QuickNode's Outages, like incident title, description, updates, and the parts of the affected service. Additionally, users can create internal status pages and set up notifications for all their third-party services.
Latest Articles from our Blog


Monitor QuickNode Dashboard status and get alerts when it's down
14-day free trial · No credit card required · No code required