Is Granicus Down? Current Status and Outages
Granicus status updated a few minutes ago

Current Granicus status
Granicus is working normally
IsDown last checked Granicus status on at . We've received 0 user reports in the past 24 hours.
Want to know the next time Granicus is down? Start free 14-day trial.
Monitoring since Apr 2020
·
849 incidents caught
·
25 components tracked in real-time
Granicus service health over the last 24 hours
This chart shows the number of user-reported issues for Granicus service health over the past 24 hours, grouped into 20-minute intervals. It's normal to see occasional reports, which may be due to individual user issues rather than a broader problem. Sign up to get alerts when Granicus is down.
Outage Map
See where users report Granicus is down. The map shows recent Granicus outages from around the world.
Granicus Outage MapTrusted by 1,000+ teams
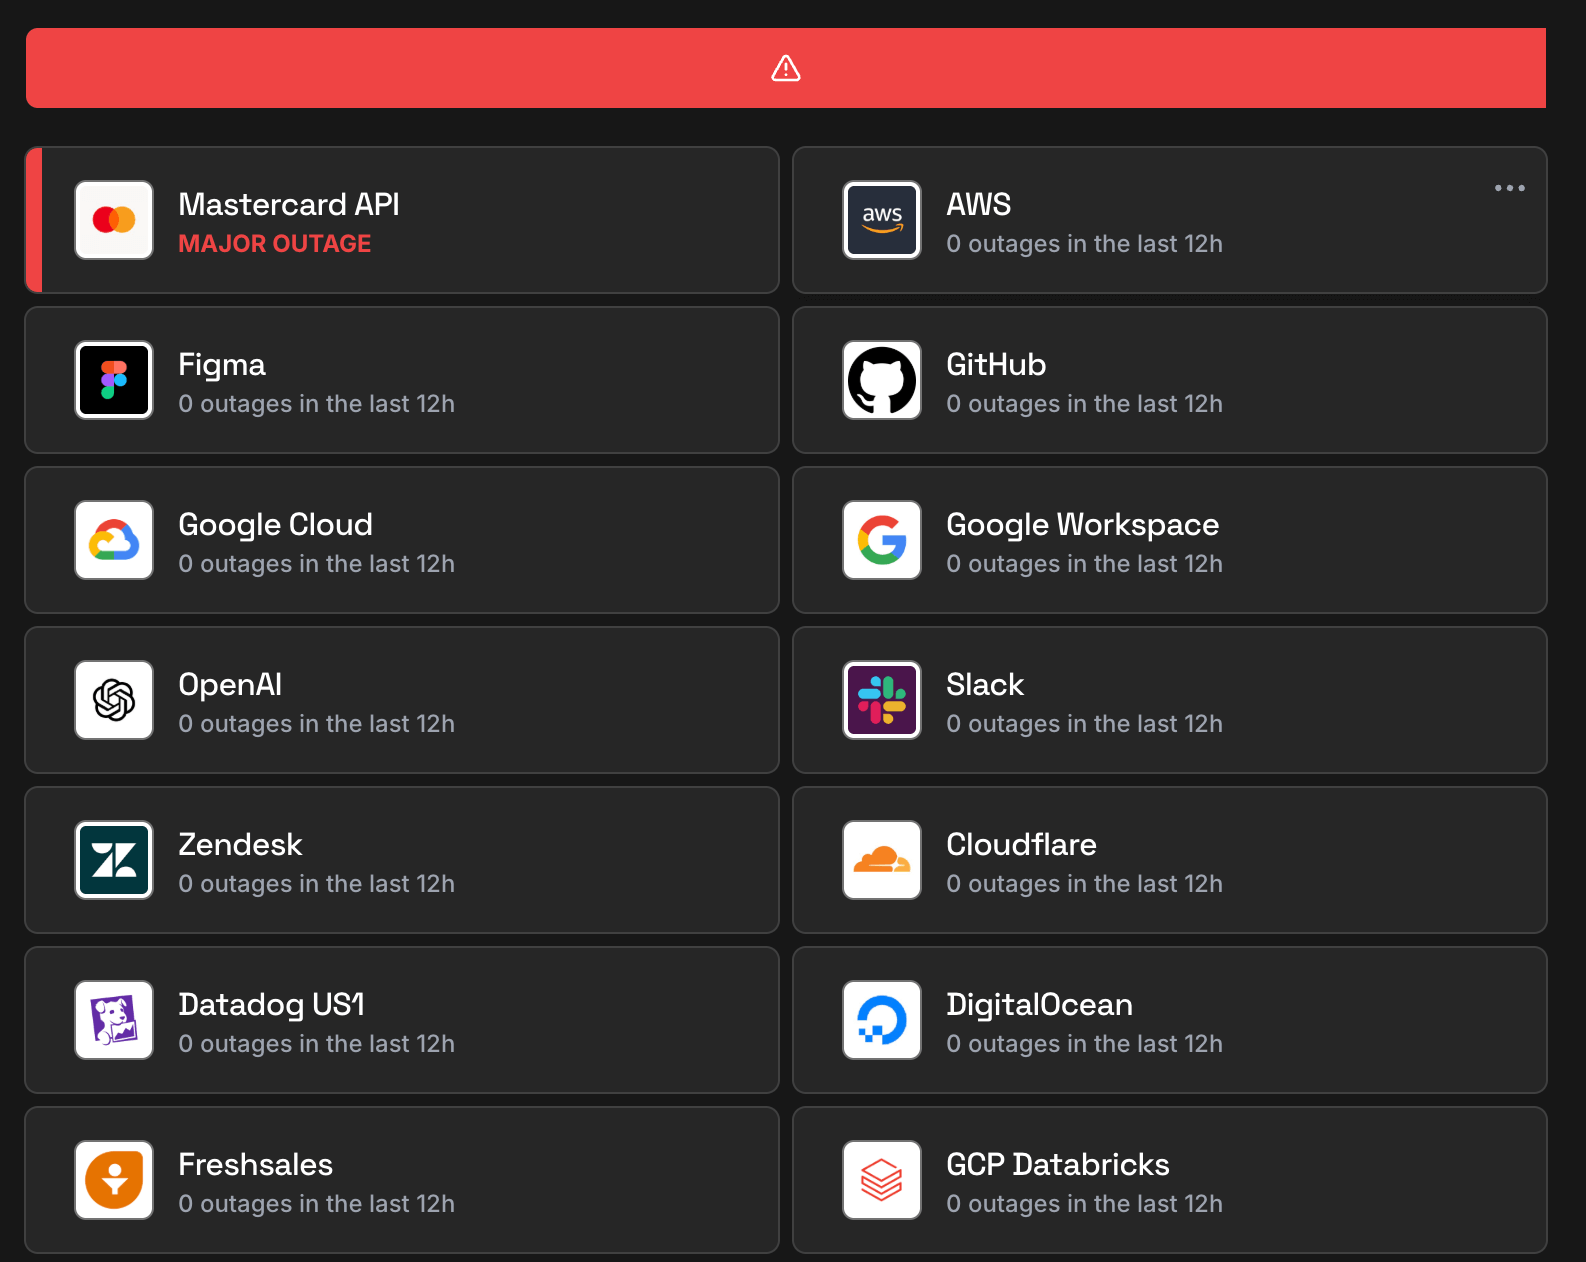
The Status Page Aggregator with Early Outage Detection
Stop finding out about outages from your users. Monitor 6,320+ cloud services and get alerted the second something breaks.

Related services
GitHub
AWS
Adobe
Salesforce
Google Workspace
Microsoft Azure
Zoom
Asana
Duo Security
Box
Omnissa Access
Microsoft 365 Consumer
Slack
SurveyMonkey
Cloudflare
GitHub
AWS
Adobe
Salesforce
Google Workspace
Microsoft Azure
Zoom
Asana
Duo Security
Box
Omnissa Access
Microsoft 365 Consumer
Slack
SurveyMonkey
Cloudflare
Granicus Downtime Health — Last 90 Days
In the last 90 days, Granicus had 69 incidents (40 major outages and 29 minor incidents) with a median duration of 2 hours 31 minutes.
69
Incidents
40
Major Outages
29
Minor Incidents
2
hour
Median Resolution
Recent Granicus outages detected
Full incident reports for recent Granicus outages, including timelines, affected components, and resolution details.
about 6 hours
Jul 23, 2026 at 12:27 PM
| Title | IsDown detected At | Duration |
|---|---|---|
|
Granicus Engineering is currently investigating an issue impacting the InSite platform where some...
|
Jul 29, 2026 at 04:31 PM UTC
|
2 days |
|
Granicus Engineering teams are currently investigating an issue affecting RTMP streaming for cert...
|
Jul 28, 2026 at 05:38 PM UTC
|
about 7 hours |
|
Granicus Engineering teams are currently investigating reports of elevated latency and intermitte...
|
Jul 27, 2026 at 04:20 PM UTC
|
about 9 hours |
|
We are currently investigating an issue impacting the Swagit Admin Portal, Broadcast page, and ac...
|
Jul 24, 2026 at 03:58 PM UTC
|
2 days |
|
Granicus Engineering teams are currently investigating an issue impacting govMeetings MediaManage...
|
Jul 24, 2026 at 03:25 PM UTC
|
about 1 hour |
|
Granicus Engineering teams are currently investigating an issue impacting govMeetings MediaManage...
|
Jul 24, 2026 at 03:25 PM UTC
|
25 minutes |
|
Granicus engineering teams are investigating an issue that affects a subset of Simpleview CRM sit...
|
Jul 24, 2026 at 02:29 PM UTC
|
about 2 hours |
|
Granicus Engineering teams are currently investigating an issue impacting govMeetings Live Video....
|
Jul 24, 2026 at 11:11 AM UTC
|
about 1 hour |
|
Granicus Engineering team is currently investigating an issue impacting the Act-On integration wi...
|
Jul 23, 2026 at 04:27 PM UTC
|
about 6 hours |
|
We are aware of an issue affecting document redaction annotations. Some customers may be unable t...
|
Jul 22, 2026 at 07:37 PM UTC
|
about 16 hours |
Granicus Scheduled Maintenances
Check upcoming Granicus maintenance windows. 2 scheduled maintenances may affect Granicus status.
-
Aug 06 2026govService Release 583 - 6th August 2026 (US)
Scheduled for August 06, 2026 at 03:00 AM EDT · until 07:30 AM EDT
Release 583 will apply essential updates to the govService platform for all US customers on Thursday, 6th August 2026 There will be no impact to the live processing of cases. Usually, there is no loss in service as part of this scheduled enginee...
-
Aug 11 2026Granicus Communications STAGE Environment scheduled maintenance: August 11th, 10:00 am - 2:00 PM CT
Scheduled for August 11, 2026 at 11:00 AM EDT · until 03:00 PM EDT
Beginning at 10 AM Central Time on Tuesday, August 11th, Granicus technical teams will be performing maintenance affecting our Granicus Communications STAGE environment for Communications Cloud and TMS applications. Although we take steps to keep ...
Granicus Components Status
Check if any Granicus component is down. View the current status of 5 services and regions.
Monitor Granicus alongside these services
Teams that track Granicus status also keep an eye on these services. Add them all to your IsDown dashboard for a single view of your dependencies.

CDC
Government & Public Sector
OK

Vermont Judiciary
Government & Public Sector
OK

Fleetworthy
Government & Public Sector
OK

GovDash
Government & Public Sector
OK

Indiana Department of Education
Government & Public Sector
OK
National Weather Service
Government & Public Sector
OK

Ubiquiti
Network Infrastructure
OK

Toast
E-Commerce
OK

Basecamp / 37signals
Project & Work Management
OK

Jira Software
Project & Work Management
OK

GitHub
Version Control & Collaboration
OK

100ms
Video & Web Conferencing
OK

Maricopa County OET GIS
Government & Public Sector
OK

Munisense
Government & Public Sector
OK

CivicPlus
Government & Public Sector
MINOR
About Granicus Status and Outage Monitoring
IsDown has monitored Granicus continuously since April 2020, tracking this Government & Public Sector for 6 years. Over that time, we've documented 849 outages and incidents, averaging 11.3 per month.
We monitor Granicus's official status page across 25 components organized into 5 groups. IsDown interprets Granicus statuses (operational, degraded performance, partial outage, and major outage) to deliver precise health metrics and filter alerts by the components you actually use.
To check if Granicus is down, IsDown combines official status data with user reports for early detection. Vendors often delay acknowledging problems, so user reports help us alert you before the official announcement.
Engineering and operations teams rely on IsDown to track Granicus status and receive verified outage alerts through Slack, Teams, PagerDuty, or 20+ other integrations.
How IsDown Monitors Granicus
IsDown checks Granicus's status page every few minutes, across all 25 components. We combine official status data with user reports to detect when Granicus is down, often before the vendor announces it.
When Granicus status changes, IsDown sends alerts to your preferred channels. Filter by severity to skip noise and focus on outages that affect your business.
What you get when monitoring Granicus with IsDown
Track Granicus incidents and downtimes by severity
IsDown checks Granicus official status page for major/minor outages or downtimes. A major outage is when Granicus experiences a critical issue that severely affects one or more services/regions. A minor incident is when Granicus experiences a small issue affecting a small percentage of its customer's applications. An example is the performance degradation of an application. The moment we detect a Granicus outage, we send you an alert and update your dashboard and status page.
Get alerted as soon as users report problems with Granicus
Granicus and other vendors don't always report outages on time. IsDown collects user reports to provide early detection of outages. This way, even without an official status update, you can stay ahead of possible problems.
All the details of Granicus outages and downtimes
IsDown collects all information from the outages published in Granicus status page to provide the context of the outage. If available, we gather the title, description, time of the outage, status, and outage updates. Another important piece of information is the affected services/regions which we use to filter the notifications that impact your business.
Prepare for upcoming Granicus maintenance events
Granicus publishes scheduled maintenance events on their status page. IsDown collects all the information for each event and creates a feed that people can follow to ensure they are not surprised by unexpected downtime or problems. We also send the feed in our weekly report, alerting the next maintenances that will take place.
Only get alerted on the Granicus outages that impact your business
IsDown monitors Granicus and all their 25 components that can be affected by an outage. IsDown allows you to filter the notifications and status page alerts based on the components you care about. For example, you can choose which components or regions affect your business and filter out all other outages. This way you avoid alert fatigue in your team.
Simple & powerful
How IsDown works.
Get started in minutes. Monitor all your critical services from one place.
We monitor official status pages
IsDown checks the status of over 6,320+ services every few minutes. We aggregate official status information and normalize it, plus collect crowdsourced reports for early outage detection.
You get notified instantly
When we detect an incident or status change, you receive an alert immediately. Customize notifications by service, component, or severity to avoid alert fatigue.
Everything in one dashboard
View all your services in a unified dashboard or public / private status page. Send alerts to Slack, Teams, PagerDuty, Datadog, and 20+ other tools your team already uses.
Get started free
No credit card required · 14-day free trial
Granicus Downdetector vs IsDown
Looking for Granicus outage alerts like Downdetector? IsDown monitors Granicus's official status page for verified incident data, not just user reports. Know exactly when Granicus is down, which components are affected, and when service health is restored. Here's why official Granicus status monitoring beats crowdsourced detection:
| Features | IsDown | Downdetector |
|---|---|---|
| Official Granicus status page monitoring. Know when Granicus is down with real time incident details. | ||
| Monitor 6,320+ services including Granicus in a single dashboard. | ||
| Instant Granicus outage alerts sent to Slack, Teams, PagerDuty, and more. | ||
| Combined monitoring: Granicus official status plus user reports for early outage detection. | ||
| Maintenance feed for Granicus | ||
| Granular alerts filtering by Granicus components and regions. |
Monitor Granicus Status with IsDown
14-day free trial • No credit card required
Frequently Asked Questions
Is Granicus down today?
Granicus isn't down. You can check Granicus status and incident details on the top of the page. IsDown continuously monitors Granicus official status page every few minutes. In the last 24 hours, there were 0 outages reported.
What is the current Granicus status?
Granicus is currently operational. You can check Granicus status and incident details on the top of the page. The status is updated in almost real-time, and you can see the latest outages and issues affecting customers.
Is there a Granicus outage now?
No, there is no ongoing official outage. Check on the top of the page if there are any reported problems by other users.
Is Granicus down today or just slow?
Currently there's no report of Granicus being slow. Check on the top of the page if there are any reported problems by other users.
How are Granicus outages detected?
IsDown monitors the Granicus official status page every few minutes. We also get reports from users like you. If there are enough reports about an outage, we'll show it on the top of the page.
Is Granicus having an outage right now?
Granicus last outage was on July 29, 2026 with the title "govMeetings InSite"
How often does Granicus go down?
IsDown has tracked 849 Granicus incidents since April 2020.
Is Granicus down for everyone or just me?
Check the Granicus status at the top of this page. IsDown combines official status page data with user reports to show whether Granicus is down for everyone or if the issue is on your end.
What Granicus components does IsDown monitor?
IsDown monitors 25 Granicus components in real-time, tracking the official status page for outages, degraded performance, and scheduled maintenance.
How to check if Granicus is down?
- Subscribe (if possible) to updates on the official status page.
- Create an account in IsDown. Start monitoring Granicus and get alerts in real-time when Granicus has outages.
Why use IsDown to monitor Granicus instead of the official status page?
Because IsDown is a status page aggregator, which means that we aggregate the status of multiple cloud services. You can monitor Granicus and all the services that impact your business. Get a dashboard with the health of all services and status updates. Set up notifications via Slack, Datadog, PagerDuty, and more, when a service you monitor has issues or when maintenances are scheduled.
How IsDown compares to DownDetector when monitoring Granicus?
IsDown and DownDetector help users determine if Granicus is having problems. The big difference is that IsDown is a status page aggregator. IsDown monitors a service's official status page to give our customers a more reliable source of information instead of just relying on reports from users. The integration allows us to provide more details about Granicus's Outages, like incident title, description, updates, and the parts of the affected service. Additionally, users can create internal status pages and set up notifications for all their third-party services.
Latest Articles from our Blog


Monitor Granicus status and get alerts when it's down
14-day free trial · No credit card required · No code required