Is The Graph Down? Current Status and Outages
The Graph status updated based on recent crowdsourced reports

Current The Graph status
The Graph is having a minor outage
IsDown is reporting that The Graph is having issues.
IsDown last checked The Graph status on at . We've received 0 user reports in the past 24 hours.
Want to know the next time The Graph is down? Start free 14-day trial.
Monitoring since Jun 2021
·
1,975 incidents caught
·
31 components tracked in real-time
The Graph service health over the last 24 hours
This chart shows the number of user-reported issues for The Graph service health over the past 24 hours, grouped into 20-minute intervals. It's normal to see occasional reports, which may be due to individual user issues rather than a broader problem. Sign up to get alerts when The Graph is down.
Outage Map
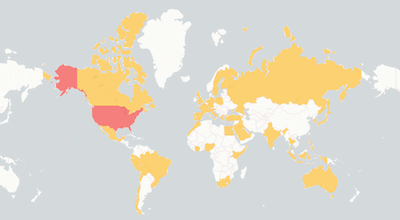
See where users report The Graph is down. The map shows recent The Graph outages from around the world.
The Graph Outage MapTrusted by 1,000+ teams
The Status Page Aggregator with Early Outage Detection
Stop finding out about outages from your users. Monitor 6,320+ cloud services and get alerted the second something breaks.

Related services
Recent The Graph outages detected
Full incident reports for recent The Graph outages, including timelines, affected components, and resolution details.
about 2 hours
Jan 12, 2026 at 01:49 PM
| Title | IsDown detected At | Duration |
|---|---|---|
|
We are currently observing degraded indexing performance on the Gnosis network. Our team is activ...
|
Jan 21, 2026 at 04:29 PM UTC
|
Ongoing |
|
Some users may encounter the following error when querying their subgraph:
bad indexers: {0xbdfb...
|
Jan 20, 2026 at 07:03 PM UTC
|
Ongoing |
|
You might be seeing
"Store error: database unavailable" and "errors":[{"message":"subgraph not f...
|
Jan 20, 2026 at 04:25 AM UTC
|
1 day |
|
[FIRING:1] DatasourceError Production (partial_outage P2-High BSC Chapel: Block ingestor lagging ...
|
Jan 17, 2026 at 09:08 PM UTC
|
36 minutes |
|
[FIRING:1] Polygon (Matic): Block ingestor lagging behind Production (partial_outage indexers P2-...
|
Jan 12, 2026 at 09:38 PM UTC
|
24 minutes |
|
Our team is currently investigating this issue.
|
Jan 12, 2026 at 06:49 PM UTC
|
about 2 hours |
|
[FIRING:1] Linea-Sepolia: Block ingestor lagging behind Production (partial_outage indexers P2-Hi...
|
Jan 11, 2026 at 05:18 PM UTC
|
about 1 hour |
|
We are currently performing scheduled software updates on the Upgrade Indexer.
At this time, we ...
|
Jan 09, 2026 at 03:00 PM UTC
|
Ongoing |
|
[FIRING:1] Polygon (Matic): Block ingestor lagging behind Production (partial_outage indexers P2-...
|
Jan 07, 2026 at 04:23 PM UTC
|
about 1 hour |
|
[FIRING:1] Etherlink-Sepolia: Block ingestor lagging behind Production (partial_outage indexers P...
|
Dec 23, 2025 at 05:58 AM UTC
|
29 days |
Monitor The Graph alongside these services
Teams that track The Graph status also keep an eye on these services. Add them all to your IsDown dashboard for a single view of your dependencies.

Base
Blockchain Services
OK

BiiLabs
Blockchain Services
OK

Solana
Blockchain Services
OK

Trust Wallet
Blockchain Services
OK

SettleMint
Blockchain Services
OK

Starknet
Blockchain Services
OK
10to8
Project & Work Management
OK

GeForce NOW
Cloud Platforms
MAINTENANCE

ServiceNow
Workflow Automation
OK
DeepSeek
API Services
OK

Steam
Gaming
OK

WhatsApp
Chat & Messaging
OK

Fireblocks
Blockchain Services
OK

NBA Top Shot
Blockchain Services
OK
Alchemy
Blockchain Services
OK
About The Graph Status and Outage Monitoring
IsDown has monitored The Graph continuously since June 2021, tracking this Blockchain Services for 5 years. Over that time, we've documented 1,975 outages and incidents.
To check if The Graph is down, IsDown combines official status data with user reports for early detection. Vendors often delay acknowledging problems, so user reports help us alert you before the official announcement.
Engineering and operations teams rely on IsDown to track The Graph status and receive verified outage alerts through Slack, Teams, PagerDuty, or 20+ other integrations.
How IsDown Monitors The Graph
IsDown checks The Graph's status page every few minutes, across all 31 components. We combine official status data with user reports to detect when The Graph is down, often before the vendor announces it.
When The Graph status changes, IsDown sends alerts to your preferred channels. Filter by severity to skip noise and focus on outages that affect your business.
Simple & powerful
How IsDown works.
Get started in minutes. Monitor all your critical services from one place.
We monitor official status pages
IsDown checks the status of over 6,320+ services every few minutes. We aggregate official status information and normalize it, plus collect crowdsourced reports for early outage detection.
You get notified instantly
When we detect an incident or status change, you receive an alert immediately. Customize notifications by service, component, or severity to avoid alert fatigue.
Everything in one dashboard
View all your services in a unified dashboard or public / private status page. Send alerts to Slack, Teams, PagerDuty, Datadog, and 20+ other tools your team already uses.
Get started free
No credit card required · 14-day free trial
Frequently Asked Questions
Is The Graph down today?
The Graph is down. You can check The Graph status and incident details on the top of the page. IsDown continuously monitors The Graph official status page every few minutes. In the last 24 hours, there were 0 outages reported.
What is the current The Graph status?
The Graph seems to be having problems. You can check The Graph status and incident details on the top of the page. The status is updated in almost real-time, and you can see the latest outages and issues affecting customers.
Is there a The Graph outage now?
Yes, there is an ongoing outage. You can check the details on the top of the page.
Is The Graph down today or just slow?
Yes, The Graph might be slow as there's an ongoing outage. You can check the details on the top of the page.
How are The Graph outages detected?
IsDown monitors the The Graph official status page every few minutes. We also get reports from users like you. If there are enough reports about an outage, we'll show it on the top of the page.
Is The Graph having an outage right now?
The Graph last outage was on January 21, 2026 with the title "Degraded Indexing Performance (Gnosis)"
How often does The Graph go down?
IsDown has tracked 1,975 The Graph incidents since June 2021.
Is The Graph down for everyone or just me?
Check the The Graph status at the top of this page. IsDown combines official status page data with user reports to show whether The Graph is down for everyone or if the issue is on your end.
What The Graph components does IsDown monitor?
IsDown monitors 31 The Graph components in real-time, tracking the official status page for outages, degraded performance, and scheduled maintenance.
How to check if The Graph is down?
- Subscribe (if possible) to updates on the official status page.
- Create an account in IsDown. Start monitoring The Graph and get alerts in real-time when The Graph has outages.
Why use IsDown to monitor The Graph instead of the official status page?
Because IsDown is a status page aggregator, which means that we aggregate the status of multiple cloud services. You can monitor The Graph and all the services that impact your business. Get a dashboard with the health of all services and status updates. Set up notifications via Slack, Datadog, PagerDuty, and more, when a service you monitor has issues or when maintenances are scheduled.
How IsDown compares to DownDetector when monitoring The Graph?
IsDown and DownDetector help users determine if The Graph is having problems. The big difference is that IsDown is a status page aggregator. IsDown monitors a service's official status page to give our customers a more reliable source of information instead of just relying on reports from users. The integration allows us to provide more details about The Graph's Outages, like incident title, description, updates, and the parts of the affected service. Additionally, users can create internal status pages and set up notifications for all their third-party services.
Latest Articles from our Blog


Monitor The Graph status and get alerts when it's down
14-day free trial · No credit card required · No code required