Is GrapheneDB Down? GrapheneDB Status & Outages
GrapheneDB status updated a few minutes ago
What is GrapheneDB status right now?
GrapheneDB is working normally
IsDown last checked GrapheneDB status on at . We've received 0 user reports in the past 24 hours.
Monitoring since Jan 2021
·
52 incidents caught
·
7 components tracked in real-time
GrapheneDB service health over the last 24 hours
This chart shows the number of user-reported issues for GrapheneDB service health over the past 24 hours, grouped into 20-minute intervals. It's normal to see occasional reports, which may be due to individual user issues rather than a broader problem.
Outage Map
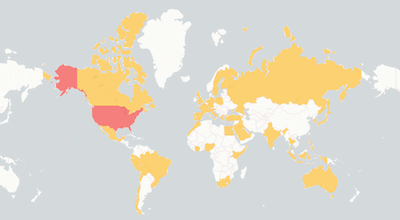
See where users report GrapheneDB is down. The map shows recent GrapheneDB outages from around the world.
GrapheneDB Outage Map
Related services
The Status Page Aggregator with Early Outage Detection
IsDown monitors GrapheneDB status and all your dependencies to alert you when something goes wrong.
Start 14-day free trial
Trusted by 500+ teams · No credit card required
Recent GrapheneDB outages detected by IsDown
Full incident reports for recent GrapheneDB outages, including timelines, affected components, and resolution details.
10 minutes
Jul 28, 2022 at 06:49 PM
10 months
Jun 10, 2021 at 10:50 PM
over 1 year
Jul 29, 2020 at 02:52 PM
| Title | Started At | Duration |
|---|---|---|
|
AWS is reporting issues with some instances within a single Availability Zone (USE2-AZ1) in the U...
|
Jul 28, 2022 at 05:49 PM UTC
|
10 minutes |
|
AWS is reporting issues in one of the AZ of the eu-west-2 region and we are seeing some databases...
|
Jul 10, 2022 at 05:54 PM UTC
|
about 5 hours |
|
There's an issue with our Documentation page that relies on ReadMe service that is suffering an o...
|
Feb 24, 2022 at 05:05 PM UTC
|
about 1 month |
|
We are currently investigating this issue.
|
Jan 05, 2022 at 01:03 PM UTC
|
3 months |
|
AWS is reporting issues with the EC2 API in the US-EAST-1. They have identified the root cause an...
|
Dec 07, 2021 at 06:00 PM UTC
|
4 months |
|
AWS is experiencing from connectivity issues affecting EC2 instances in a single Availability Zon...
|
Jun 10, 2021 at 09:50 PM UTC
|
10 months |
|
We are currently investigating this issue.
|
Jan 13, 2021 at 11:13 AM UTC
|
about 1 year |
|
AWS is suffering from connectivity issues in the US-EAST-1 region, which is affecting new databas...
|
Sep 16, 2020 at 02:20 PM UTC
|
over 1 year |
|
We have detected an issue on our Management API and we are currently working on a fix
|
Sep 15, 2020 at 02:55 PM UTC
|
over 1 year |
|
AWS is suffering from connectivity issues in a single Availability Zone in the US-EAST-1 region, ...
|
Jul 29, 2020 at 01:52 PM UTC
|
over 1 year |
Get alerts when GrapheneDB goes down
IsDown monitors GrapheneDB status and alerts you instantly via Slack, Teams, PagerDuty and more.
Start 14-day free trial
Trusted by 500+ teams · No credit card required
GrapheneDB Components Status
Check if any GrapheneDB component is down. View the current status of 7 services and regions.
| Component | Status |
|---|---|
| Documentation page | OK |
| Hobby Database Tier | OK |
| Management API | OK |
| Performance Database Tier | OK |
| Standard Database Tier | OK |
| User interface and public API | OK |
| Website | OK |
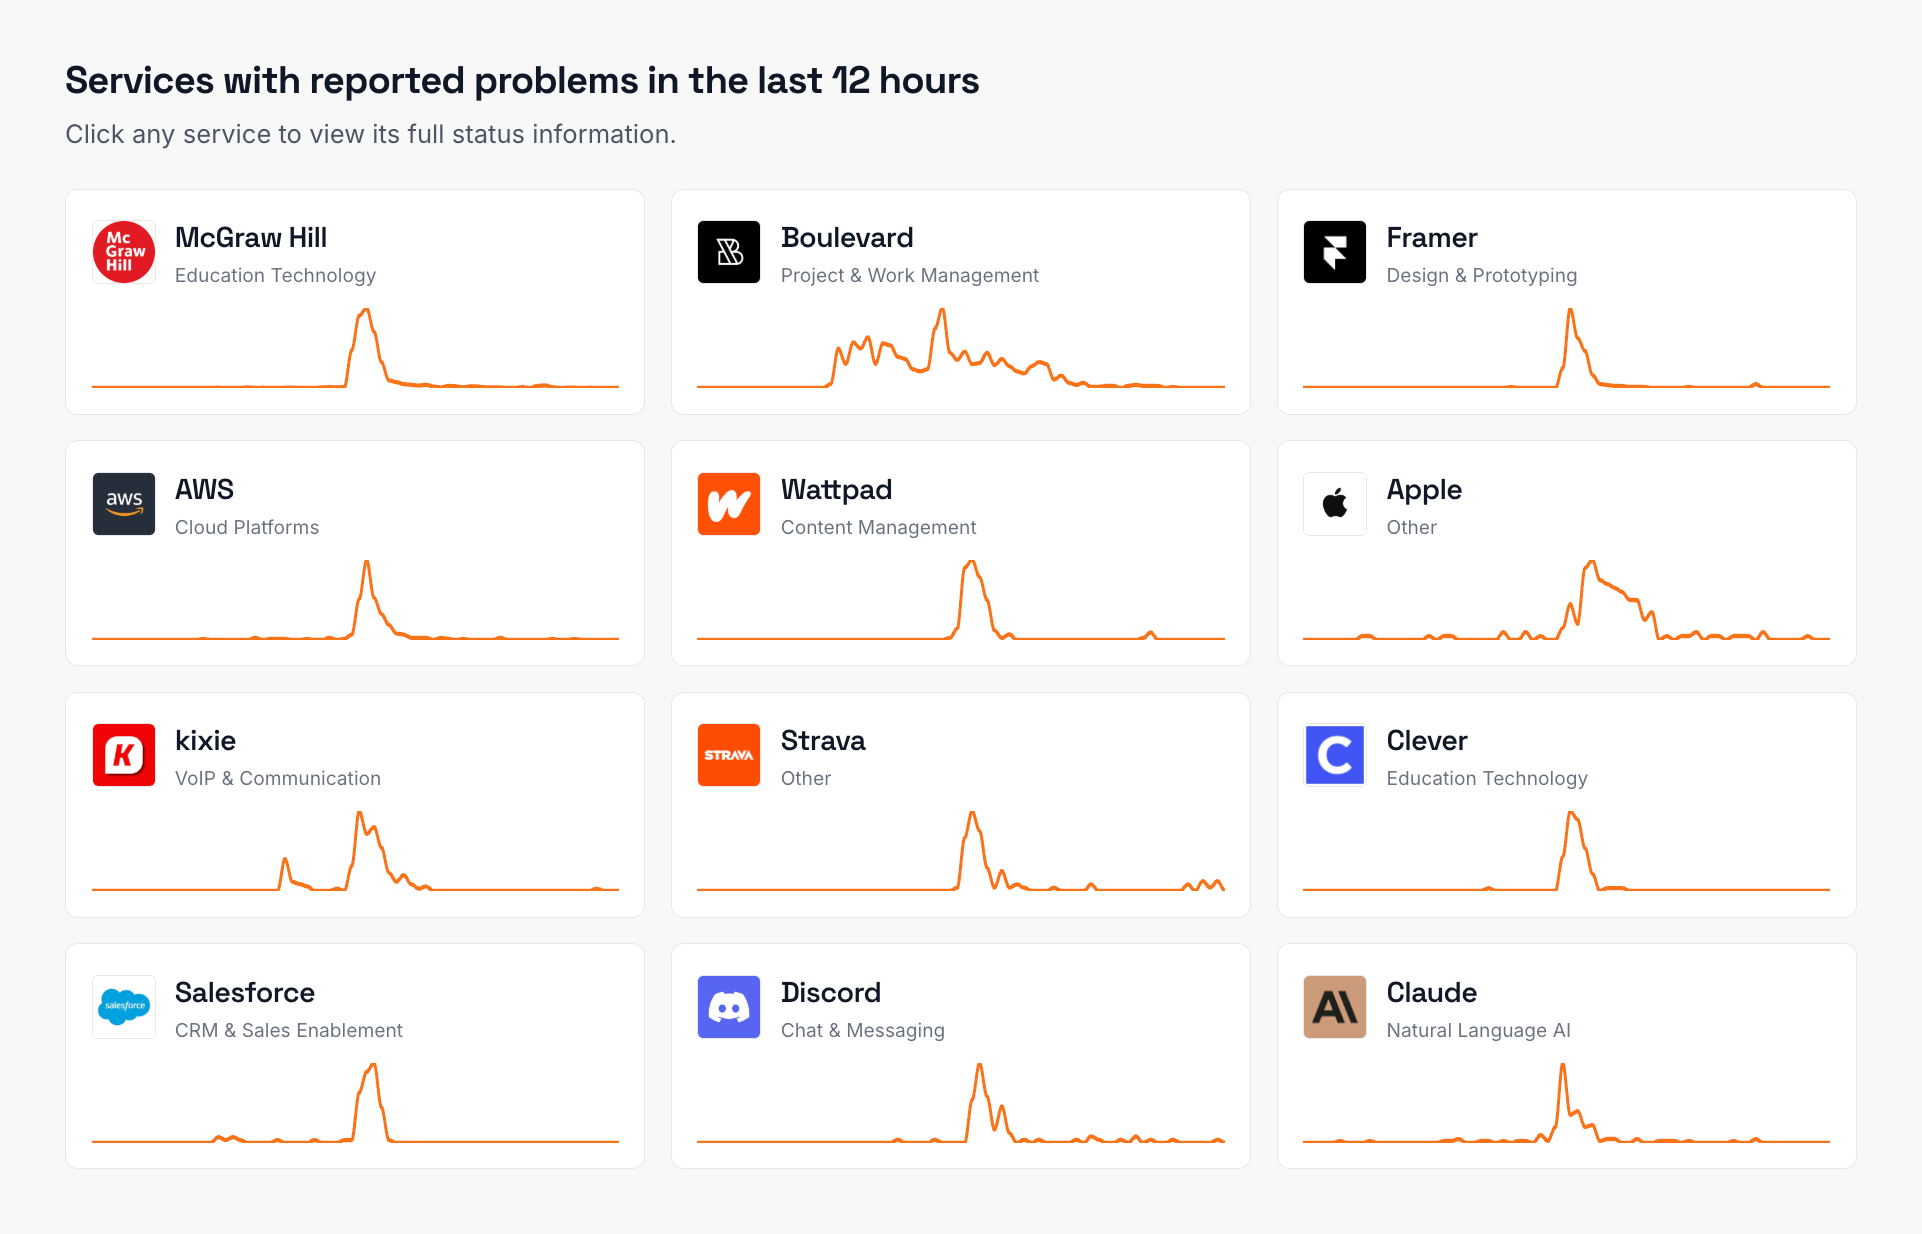
Never be the last to know about a vendor outage
Catch outages early, sometimes before vendors acknowledge them. Alerts in Slack, Teams, PagerDuty, Datadog, etc. Monitoring 6,020+ of the most popular apps.
Get GrapheneDB outage alerts14-day free trial · Learn more
Monitor GrapheneDB alongside these services
Teams that track GrapheneDB status also keep an eye on these services. Add them all to your IsDown dashboard for a single view of your dependencies.

Wasabi
Databases & Storage
OK

Redis
Databases & Storage
OK

DRACOON
Databases & Storage
OK
CloudTables
Databases & Storage
OK

Zilliz
Databases & Storage
OK
Pinecone
Databases & Storage
OK

SendGrid
Email Delivery
OK

Mimecast
Email Delivery
OK

Verizon
VoIP & Communication
OK

TikTok
Social Media Platforms
OK

SAP Concur
Expense Tracking
OK

WhatsApp
Chat & Messaging
OK

QTICloud
Databases & Storage
OK

OpenCorporates
Databases & Storage
OK

Poka
Databases & Storage
OK
About GrapheneDB Status and Outage Monitoring
IsDown has monitored GrapheneDB continuously since January 2021, tracking this Databases & Storage for 5 years. Over that time, we've documented 52 outages and incidents, averaging 0.9 per month.
We monitor GrapheneDB's official status page across 7 components. IsDown interprets GrapheneDB statuses (operational, degraded performance, partial outage, and major outage) to deliver precise health metrics and filter alerts by the components you actually use.
To check if GrapheneDB is down, IsDown combines official status data with user reports for early detection. Vendors often delay acknowledging problems, so user reports help us alert you before the official announcement.
Engineering and operations teams rely on IsDown to track GrapheneDB status and receive verified outage alerts through Slack, Teams, PagerDuty, or 20+ other integrations.
How IsDown Monitors GrapheneDB
IsDown checks GrapheneDB's status page every few minutes, across all 7 components. We combine official status data with user reports to detect when GrapheneDB is down, often before the vendor announces it.
When GrapheneDB status changes, IsDown sends alerts to your preferred channels. Filter by severity to skip noise and focus on outages that affect your business.
What you get when monitoring GrapheneDB with IsDown
Track GrapheneDB incidents and downtimes by severity
IsDown checks GrapheneDB official status page for major/minor outages or downtimes. A major outage is when GrapheneDB experiences a critical issue that severely affects one or more services/regions. A minor incident is when GrapheneDB experiences a small issue affecting a small percentage of its customer's applications. An example is the performance degradation of an application. The moment we detect a GrapheneDB outage, we send you an alert and update your dashboard and status page.
Get alerted as soon as users report problems with GrapheneDB
GrapheneDB and other vendors don't always report outages on time. IsDown collects user reports to provide early detection of outages. This way, even without an official status update, you can stay ahead of possible problems.
All the details of GrapheneDB outages and downtimes
IsDown collects all information from the outages published in GrapheneDB status page to provide the context of the outage. If available, we gather the title, description, time of the outage, status, and outage updates. Another important piece of information is the affected services/regions which we use to filter the notifications that impact your business.
Prepare for upcoming GrapheneDB maintenance events
GrapheneDB publishes scheduled maintenance events on their status page. IsDown collects all the information for each event and creates a feed that people can follow to ensure they are not surprised by unexpected downtime or problems. We also send the feed in our weekly report, alerting the next maintenances that will take place.
Only get alerted on the GrapheneDB outages that impact your business
IsDown monitors GrapheneDB and all their 7 components that can be affected by an outage. IsDown allows you to filter the notifications and status page alerts based on the components you care about. For example, you can choose which components or regions affect your business and filter out all other outages. This way you avoid alert fatigue in your team.
Simple & Powerful
How IsDown Works
Get started in minutes. Monitor all your critical services from one place.
Step 01
We monitor official status pages
IsDown checks the status of over 6,020+ services every few minutes. We aggregate official status information and normalize it, plus collect crowdsourced reports for early outage detection.
Step 02
You get notified instantly
When we detect an incident or status change, you receive an alert immediately. Customize notifications by service, component, or severity to avoid alert fatigue.
Step 03
Everything in one dashboard
View all your services in a unified dashboard or public or private status page. Send alerts to Slack, Teams, PagerDuty, Datadog, and 20+ other tools your team already uses.
Get Started Free
No credit card required • 14-day free trial
GrapheneDB Downdetector vs IsDown
Looking for GrapheneDB outage alerts like Downdetector? IsDown monitors GrapheneDB's official status page for verified incident data, not just user reports. Know exactly when GrapheneDB is down, which components are affected, and when service health is restored. Here's why official GrapheneDB status monitoring beats crowdsourced detection:
| Features | IsDown | Downdetector |
|---|---|---|
| Official GrapheneDB status page monitoring. Know when GrapheneDB is down with real time incident details. | ||
| Monitor 6,020+ services including GrapheneDB in a single dashboard. | ||
| Instant GrapheneDB outage alerts sent to Slack, Teams, PagerDuty, and more. | ||
| Combined monitoring: GrapheneDB official status plus user reports for early outage detection. | ||
| Maintenance feed for GrapheneDB | ||
| Granular alerts filtering by GrapheneDB components and regions. |
Monitor GrapheneDB Status with IsDown
14-day free trial • No credit card required
Frequently Asked Questions
Is GrapheneDB down today?
GrapheneDB isn't down. You can check GrapheneDB status and incident details on the top of the page. IsDown continuously monitors GrapheneDB official status page every few minutes. In the last 24 hours, there were 0 outages reported.
What is the current GrapheneDB status?
GrapheneDB is currently operational. You can check GrapheneDB status and incident details on the top of the page. The status is updated in almost real-time, and you can see the latest outages and issues affecting customers.
Is there a GrapheneDB outage now?
No, there is no ongoing official outage. Check on the top of the page if there are any reported problems by other users.
Is GrapheneDB down today or just slow?
Currently there's no report of GrapheneDB being slow. Check on the top of the page if there are any reported problems by other users.
How are GrapheneDB outages detected?
IsDown monitors the GrapheneDB official status page every few minutes. We also get reports from users like you. If there are enough reports about an outage, we'll show it on the top of the page.
Is GrapheneDB having an outage right now?
GrapheneDB last outage was on July 28, 2022 with the title "AWS is reporting issues in Availability Zone (USE2-AZ1) in the US-EAST-2 Region"
How often does GrapheneDB go down?
IsDown has tracked 52 GrapheneDB incidents since January 2021.
Is GrapheneDB down for everyone or just me?
Check the GrapheneDB status at the top of this page. IsDown combines official status page data with user reports to show whether GrapheneDB is down for everyone or if the issue is on your end.
What GrapheneDB components does IsDown monitor?
IsDown monitors 7 GrapheneDB components in real-time, tracking the official status page for outages, degraded performance, and scheduled maintenance.
How to check if GrapheneDB is down?
- Subscribe (if possible) to updates on the official status page.
- Create an account in IsDown. Start monitoring GrapheneDB and get alerts in real-time when GrapheneDB has outages.
Why use IsDown to monitor GrapheneDB instead of the official status page?
Because IsDown is a status page aggregator, which means that we aggregate the status of multiple cloud services. You can monitor GrapheneDB and all the services that impact your business. Get a dashboard with the health of all services and status updates. Set up notifications via Slack, Datadog, PagerDuty, and more, when a service you monitor has issues or when maintenances are scheduled.
How IsDown compares to DownDetector when monitoring GrapheneDB?
IsDown and DownDetector help users determine if GrapheneDB is having problems. The big difference is that IsDown is a status page aggregator. IsDown monitors a service's official status page to give our customers a more reliable source of information instead of just relying on reports from users. The integration allows us to provide more details about GrapheneDB's Outages, like incident title, description, updates, and the parts of the affected service. Additionally, users can create internal status pages and set up notifications for all their third-party services.
Latest Articles from our Blog
Monitor GrapheneDB status and get alerts when it's down
14-day free trial · No credit card required · No code required