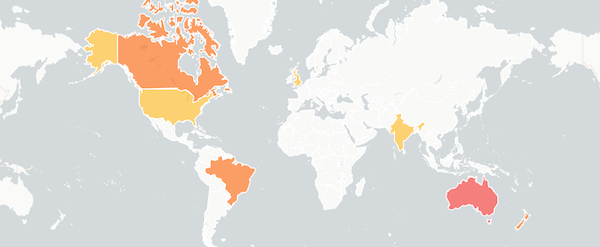
This chart provides user-reported problems for Grafana in the last 12 hours. It's a collection of user reports from different sources.
We continuously monitor the official Grafana status page for updates on any ongoing outages. Check the stats for the latest 30 days and a list of the last Grafana outages.
Major · started about 9 hours ago
Azure US Central - us-central2 Hosted Metrics (Prometheus) Partial Outage
At present, there is a partial outage affecting the us-central2 Azure Hosted Metrics service (Prometheus/Mimir/Graphite) with writing metrics. Our engineering team is actively investigating the issue at this time. Users may encounter 500 errors when attempting to push metrics to Grafana Cloud, and most clients (Grafana Agent, Prometheus, etc.) will attempt retries if possible until service is restored.
Minor Resolved · 1 day ago · lasted about 2 hours
We are currently investigating an issue with confluent and cloudwatch hosted exporters
14 day free trial · No credit card required
Major Resolved · 5 days ago · lasted 4 days
As of 20:24 UTC, we were alerted to a third-party service disruption that is impacting the prod-us-central-0 and prod-us-central-3 clusters, only. Engineering is actively engaged to remediate and restore functionality. Instances within the us-prod-central-0 and us-prod-central-3 clusters may experience an inability to initialize or start. We will continue to provide updates as we learn more.
Minor Resolved · 6 days ago · lasted 30 minutes
Hosted Grafana Instances degradation in prod-us-central
We were alerted to a quantity of pods entering a poor state within the us-prod-central-0 cluster, only. Instances within the us-prod-central-0 cluster may experience performance degradation or an inability to initialize or start. We will continue to provide updates as we learn more.
Minor Resolved · 9 days ago · lasted 7 days
Synthetic Monitoring Issues - Singapore Region
As of roughly 14:00 UTC, we were alerted to some connectivity issues in Synthetic Monitoring between the Singapore probe and the us-central-0 cluster. Instances experiencing these connectivity disruptions may experience issues creating or running Synthetic Monitoring checks, or collecting data, in the Singapore region, only. We have traced the issue to a third-party provider and they are currently undergoing mitigation and correction efforts. We will continue to monitor and relay updates accordingly.
Minor Resolved · 13 days ago · lasted about 2 hours
Metrics Disruption - cortex-prod-10 cluster
As of 18:45 UTC, we observed metric disruption in the cortex-prod-10 cluster, only. Some customers in this cluster may have experienced failed metric queries or failed remote write actions, likely manifesting as 500 errors. Engineering is aware and actively engaged in investigation. We will provide updates as information is shared.
Minor Resolved · 15 days ago · lasted 2 days
Experiencing issues with Confluent Cloud Integration
We are experiencing latency and high error rates with Confluent Cloud integration in all regions. We are currently investigating this issue.
Check the current status of the components
Grafana is the open source analytics & monitoring solution for every database.
With IsDown, you can monitor all your critical services official status pages from one centralized dashboard and receive instant alerts the moment an outage is detected. Say goodbye to constantly checking multiple sites for updates and stay ahead of outages with IsDown.
Start free trialNo credit card required · Cancel anytime · 2508 services available
Integrations with
Quickly identify external outages that impact your business. We are monitoring more than 2300 services in real time.
Your team on top of problems
IsDown aggregates the information from the status pages of all your services, making it easy to monitor the health of all your services in one place. Say goodbye to managing each status page individually - our service simplifies the process.
No more wasting time. Uptime monitoring in real time
Say goodbye to wasting time trying to diagnose issues with your services - our 24/7 monitoring service does the work for you. We'll notify you if there is an incident, so you can focus on other tasks.
Receive alerts in your preferred channels
Our outage monitoring keeps you informed, no matter where you are. Get instant notifications in your email, Slack, Teams, or Discord when an outage is detected, so you can take action quickly.
Easily integrate with your current tools and workflows
Enhance your processes with more information using our integration of Zapier, Webhooks, PagerDuty, and Datadog. Stay notified and in control. Upgrade your operations today.
Avoid notifications clutter
Maximize your control with customizable notifications from each service. Filter by components and severity to only receive the most important updates. Streamline your processes and stay informed with our advanced notification features.
Multiple dashboards, shareable with the world
Create one dashboard for each of your teams/clients/projects and monitor only the services that each uses. Have a dedicated dashboard with custom notification settings. Easily make your dashboard public and share it with the world.
Prepare for scheduled maintenances
Never again be caught off guard by unexpected maintenance from your services. A feed of the next scheduled maintenances is available.
Weekly Digest of the services' outages
Every Monday, you'll receive a weekly summary of what happened the previous week as well as the maintenance schedule for the following week.
The data and notifications you need, in the tools you already use.
DevOps & On-Call Teams
You already monitor your internal systems. What about the external services? Monitor the services your business depends on. Don't waste time looking elsewhere when external outages are the cause of issues.
IT Support Teams
Detect external outages before your clients tell you. Anticipate possible issues and make the necessary arrangements. Having proactive communication, builds trust over clients and prevents flow of support tickets.
5 minute setup,
instant value for your team
Start with a trial account that will allow you to try and monitor up to 40 services for 14 days.
There are 2508 services to choose from and you can start monitoring, and we're adding more every week.
You can get notifications by email, Slack, and Discord. You can also use Zapier or Webhooks to build your workflows.
You'll start getting alerts when we detect outages in your external dependencies! No more wasting time looking in the wrong place!
Try it out! How much time you'll save your team, by having the outages information close to them?